Leadership Project
Overview
The topic for my project was the improvement in math skills at Hillside Elementary School through the use of Common Core State Standards (CCSS) based lessons, and an intervention strategy I researched and then personalized in a series of improvement cycles. I began specifically focusing on EL learners, but seeing the need schoolwide, this intervention strategy was eventually implemented in all 4th, 5th, and Special Day classes.
To provide the reader with background on our school and community, according to our school's District  Report Card, 88% of our student population is Hispanic/Latino, we have 38% EL learners, and 95% of our student population is eligible for free or reduced-price lunch. According to census data, 33% of our parent population did not graduate high school and only 9% have a college degree.
CST data tells us that in 2012-2013, 45% of all our students were at or above proficient in math, while only 37% of our EL learners were at or above proficient. Both very low numbers, thus the driving force behind my leadership project. My leadership project sought to increase the math word problem solving abilities of EL learners as measured by Smarter Balance Consortium performance task type questions.
Problem and Rationale
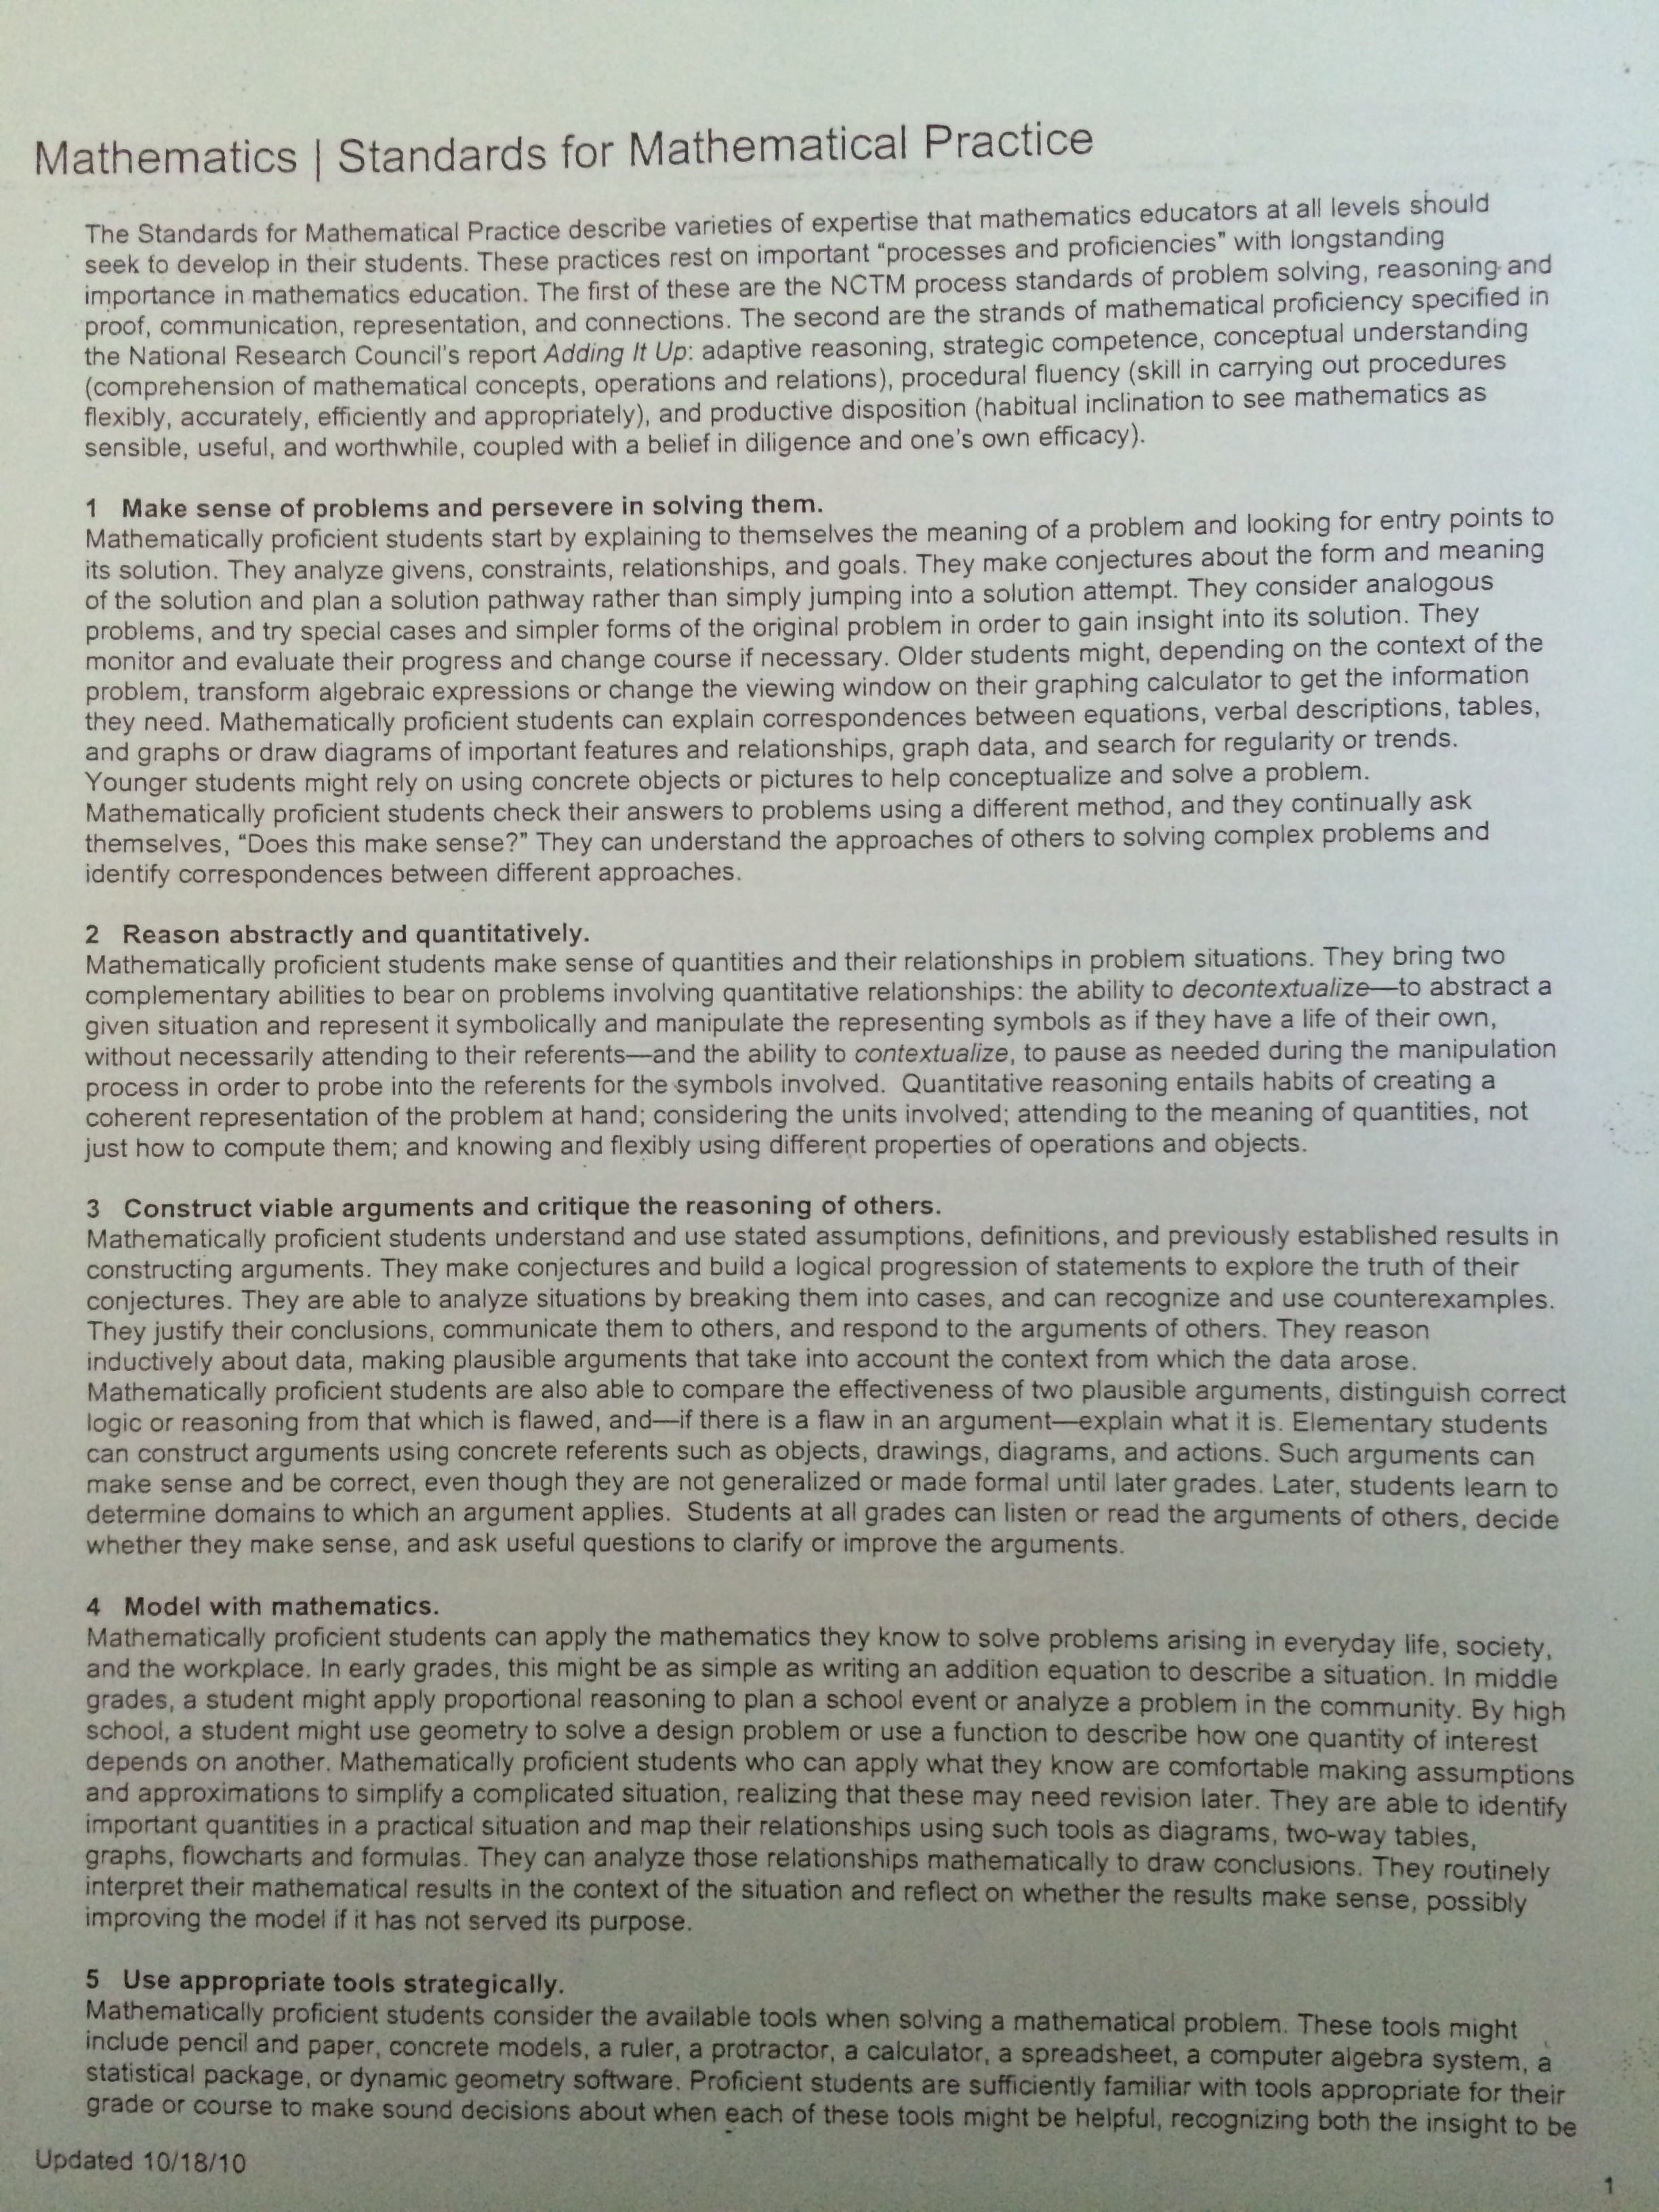
My leadership project directly addressed a District priority, to help all students, and thus English language learners access Common Core Math Practices 1 and 3 . I sought to do this using an intervention strategy that helped EL learners do a close, systematic reading of a math word problem. District Performance Assessments, given out twice this school year, were used to measure student improvement in the 4th and 5th grade classes at Hillside.
Two main concerns encouraged me to undertake this project. My first concern had to do with current EL performance as measured by student CST and CELDT scores. CST scores showed a majority of our students were struggling to simply answer multiple choice, algorithm type questions. CELDT scores showed that a majority of them were at an early intermediate to intermediate level of English acquisition. I had concerns surrounding an English Language Learner's ability to solve, then explain, justify, and defend, their math reasoning, while trying to critique the reasoning of others, and all while trying to learn a second language.
To illustrate this concern I have included CST and CELDT data. The first table shows that 37% of our English learners were at or above proficient in 2013, as measured by the Math CST scores, compared to 60% of our Asian students who were at or above proficient that same year. This means that less than half of our ELs were performing at a satisfactory level according to the old standards. Those of us in education have seen how the Common Core State Standards, assessed using the Smarter Balance Consortium, have raised the bar for all students. How will our ELs fare now? Especially considering that 63% were already not performing at benchmark using the old state standards.

According to the table above, 66% of our ELs are at the Early Intermediate to Intermediate level. Their English language skills were comparable to those of English Only first and second graders. Clearly these students would need much scaffolding to be able to solve and then explain and justify their mathematical reasoning, as well as be able to critique the reasoning of others.
With my leadership project I hoped to address the widening gap in Math, but I also hoped to positively impact this gap in English Language Arts by incorporating listening and speaking into the Math intervention.
The second major concern that encouraged me to undertake this project, as mentioned above, the Common Core State Standards will be raising the bar for everyone. For example, students will now be asked to solve math word problems and then justify their reasoning, in writing, and to critique the reasoning of others. They will be asked to demonstrate why their answer is correct using a model and an explanation. If the ELs at my school are currently not performing close to where they should be, as shown by the CST and CELDT data above, how can we expect them to access the Common Core State Standards that are asking them to do much more than simply solve equations and algorithms? This forms the rationale behind my leadership project.
Challenges/ Changes
There were several challenges that forced changes to my leadership project. Some turned out to be blessings in disguise, all were valuable learning experiences:
- The biggest change occurred mid-way through Prof. Gomez’s class where I decided to incorporate improvement (PDSA) cycles into my project. My project went from being an awareness project to an improvement project, a significant change. The rationale behind this had to do with the situation I found our ELs in, once I peeled back the layers of data. I also wanted to test out the intervention I had researched with a small group of students and gather data on them, before presenting it to more stakeholders. I wanted to see if in fact the intervention would help EL learners access the CCSS in math, as measured by their ability to solve math word problems successfully.
- This PDSA cycle format worked amazingly well for my leadership project. Phase I and II allowed my colleague and I to improve the three-phase, 6-step math word problem solving strategy we used, and our delivery of the lessons. It also allowed us to gather data to present to a larger group when the time came.
- Another big set of changes to my leadership project occurred when I decided to focus only the students in our 4th, 5th, and SDC classes versus all grade levels at our school. This change came about when we realized we wanted to implement the intervention with all students regardless of language designation, since all students showed a need to improve according to CST data. To do this school wide would have been an overwhelming task, so I decided to scale back.
- Two benefits came from the aforementioned change. One, we were now able to compare EL student growth with EO and RFEP students. The other benefit was that we could start small, learn, improve, and then implement school wide only if we saw improvement as measured by the data, and the data ended up showing significant student improvement.
Responsibilities
Phase I - After school intervention program (21 students)
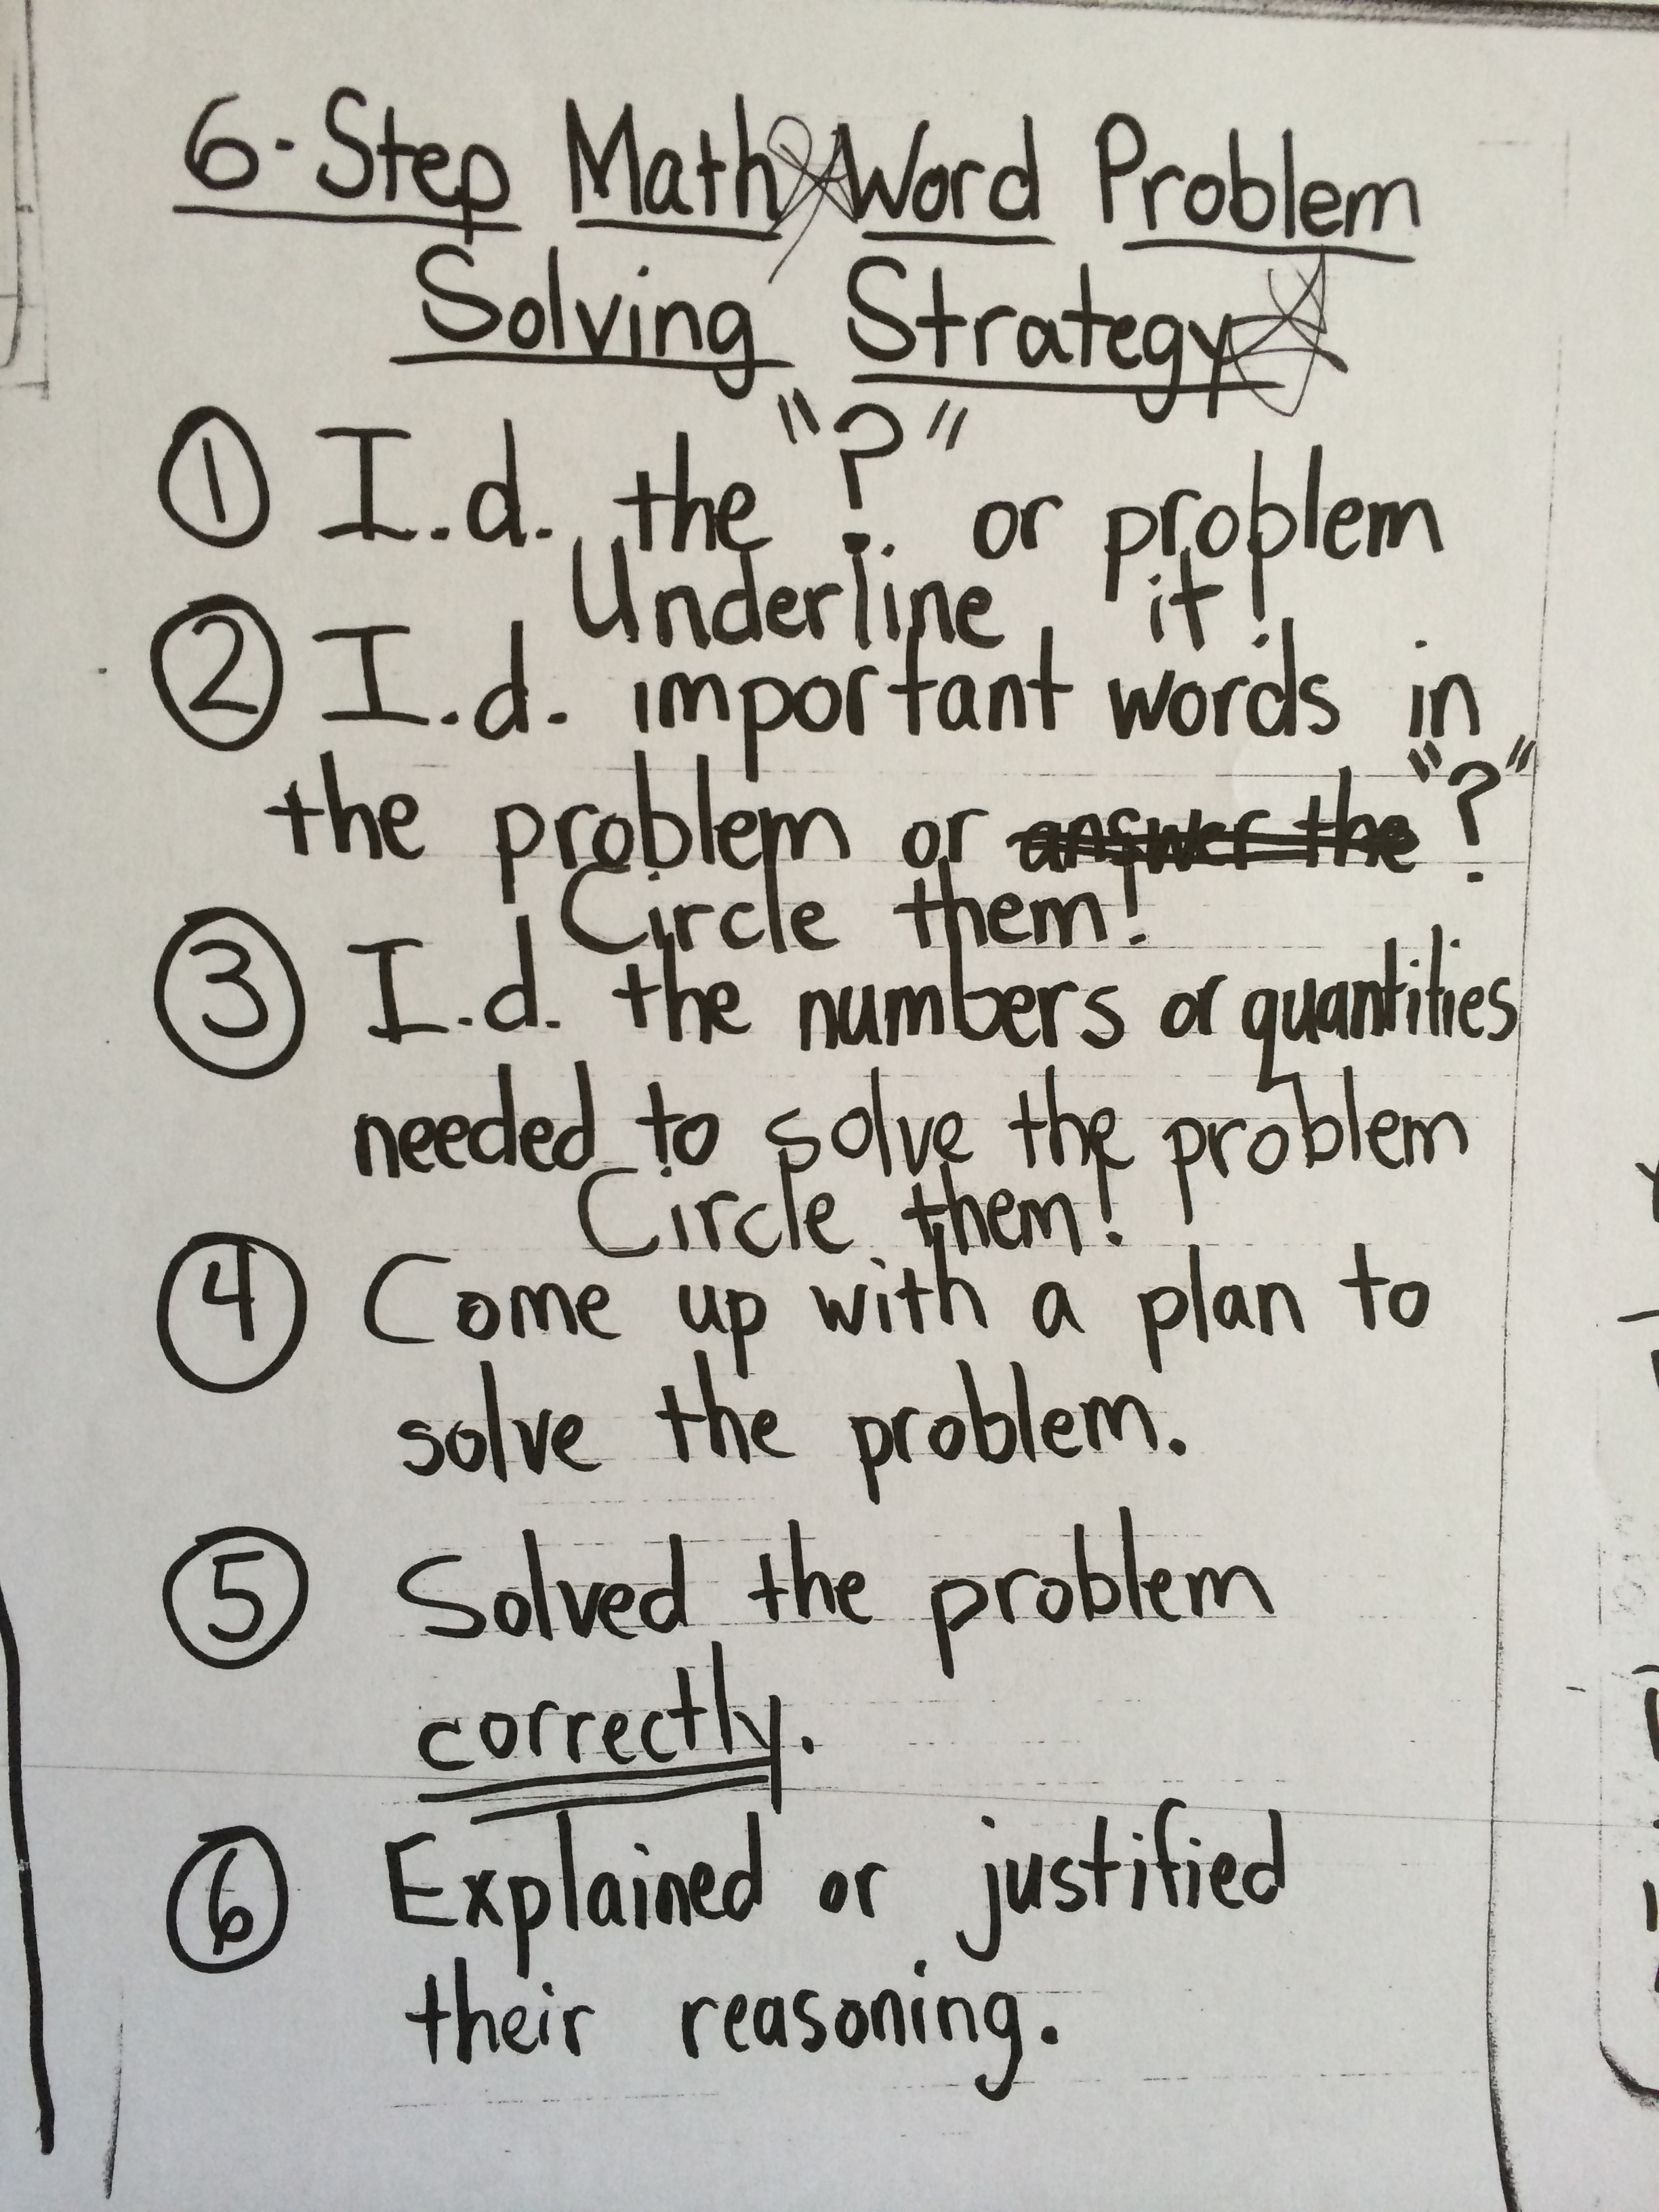
- I met in a series of grade-level meetings with my 5th grade colleague to plan our Three-Phase
 Structure math lessons to incorporate a 6-Step Math Word Problem Solving Strategy to address EL needs to be used during an after school intervention program. This took place November 19, 2013
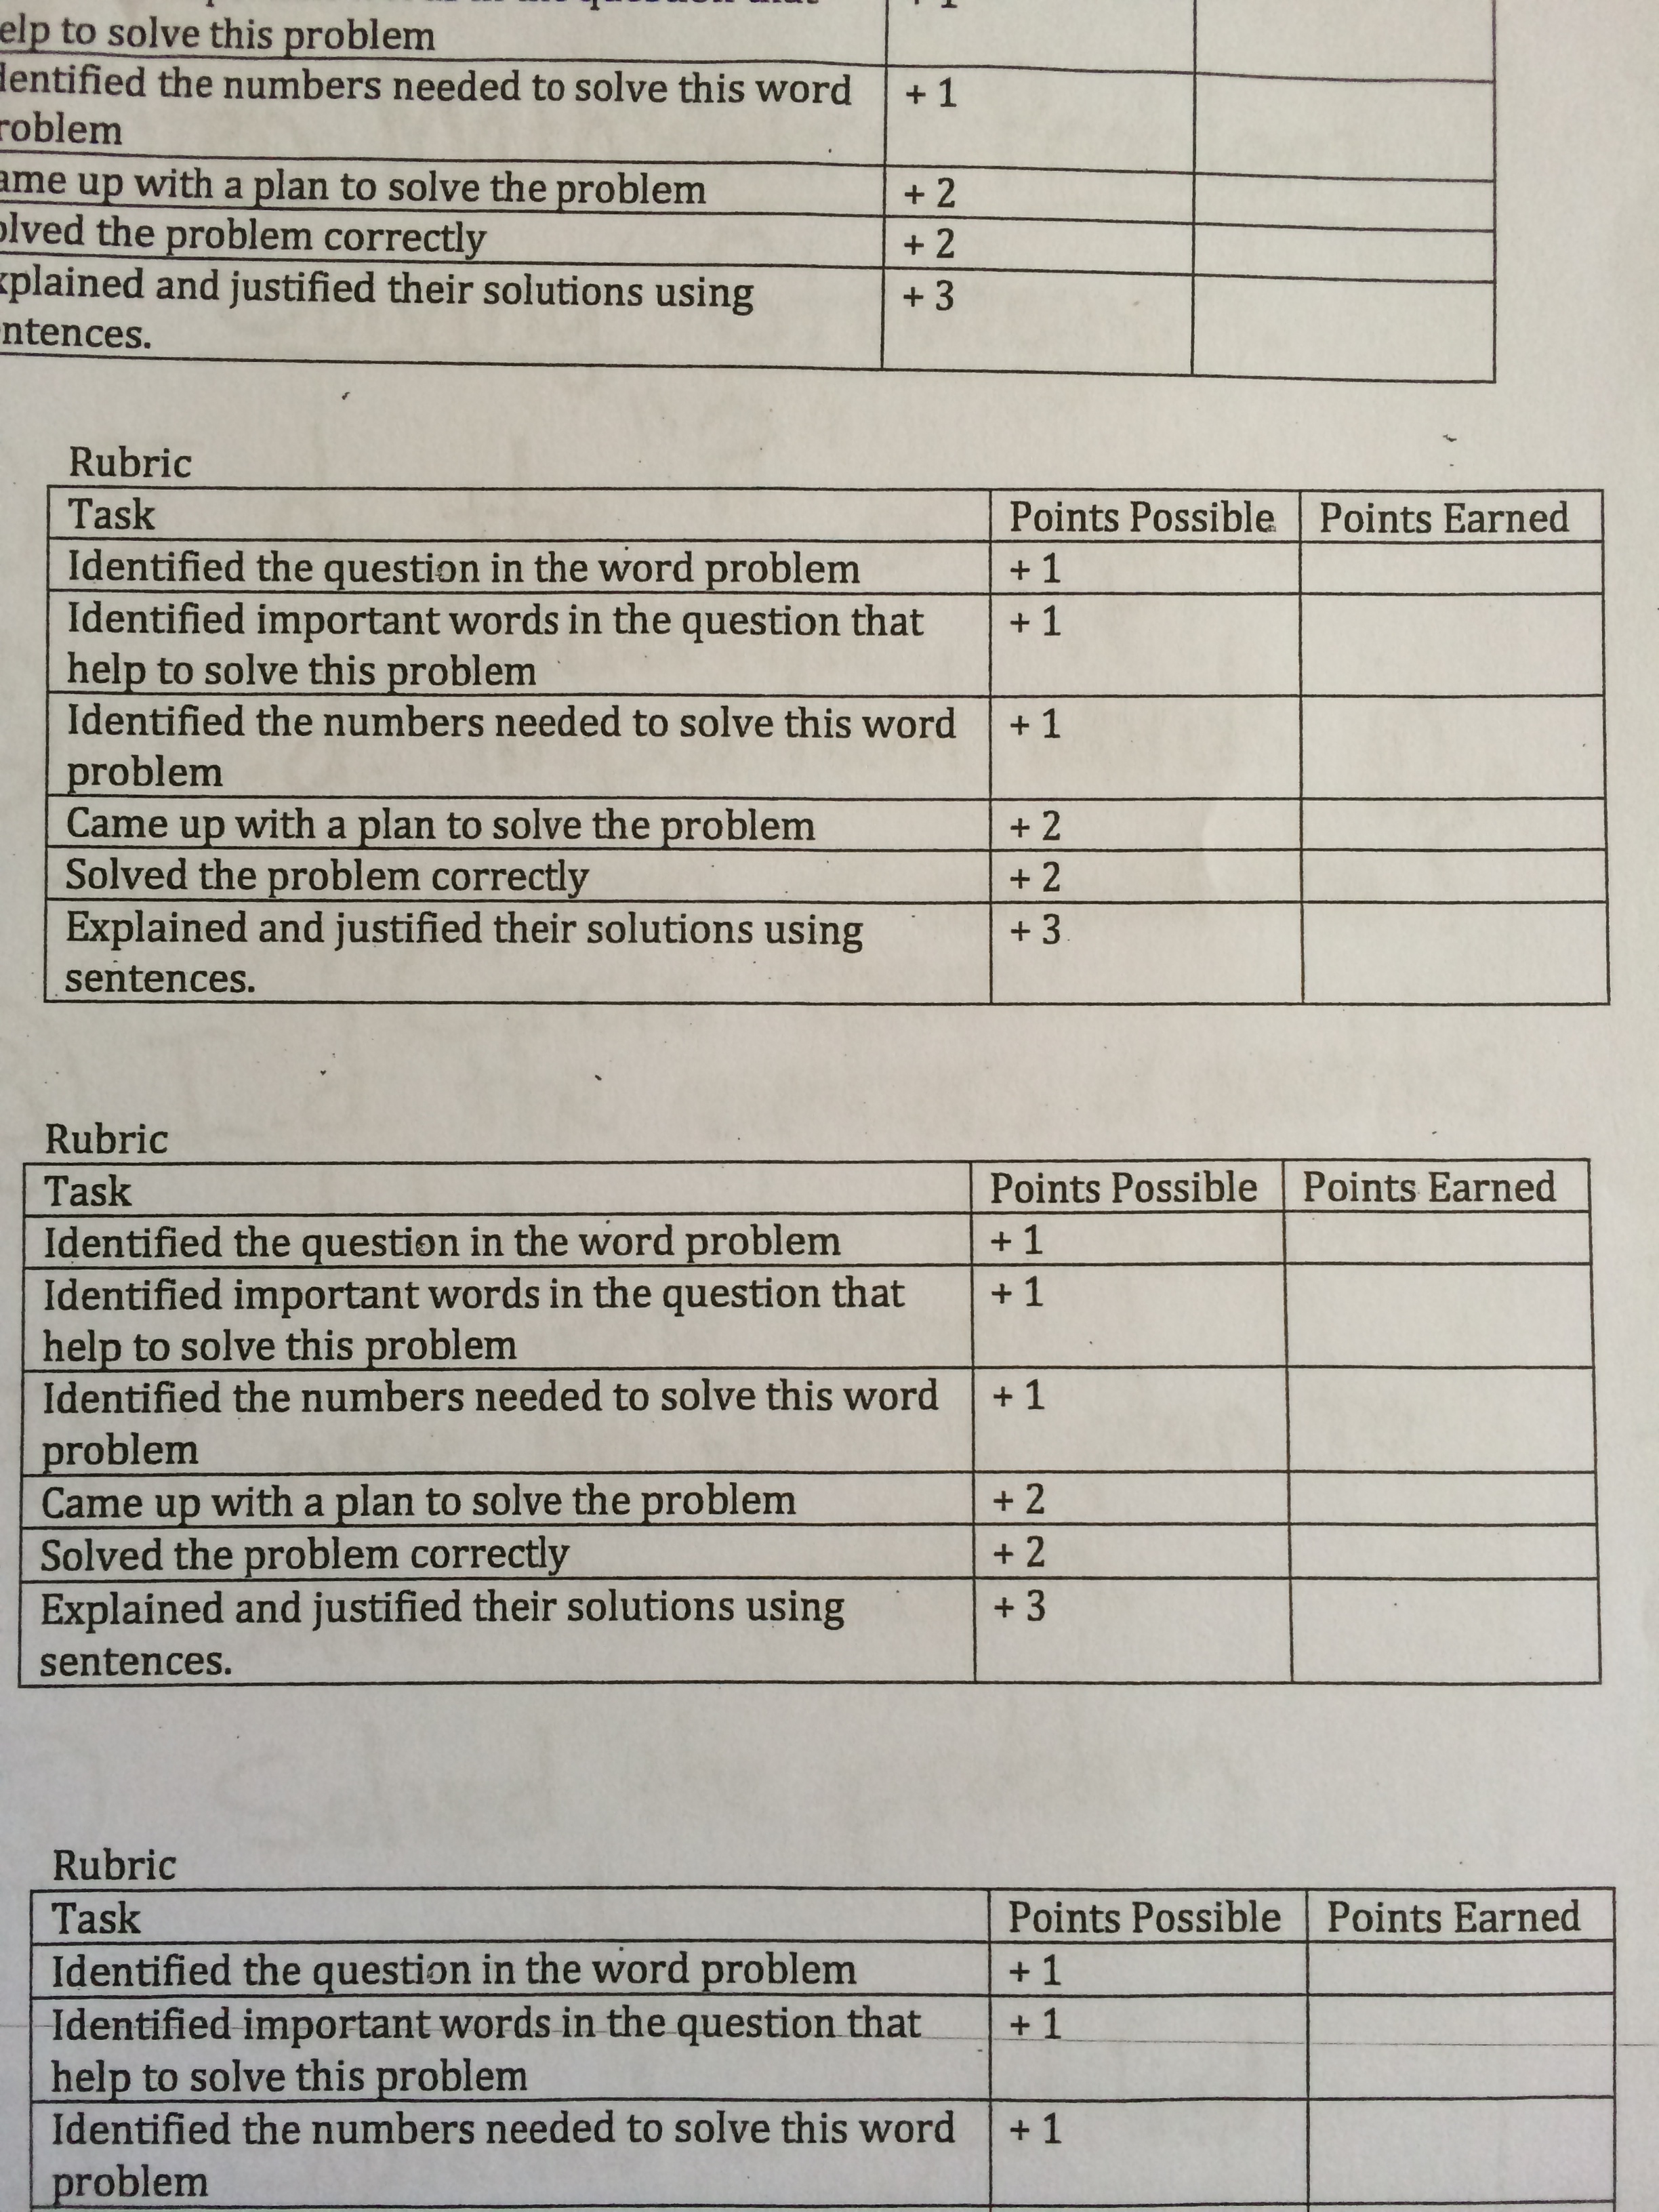
 - We gathered baseline student data and post data, we debriefed after every lesson. We created a rubric and a template to further help motivate students. This took place from November 20 thru December 11, 2013.
 Structure
Phase II - 5th Grade classes (58 students)
- Met with my 5th grade colleague to discuss further improvements to the Three-Phase Structure, 6-Step Math Word Problem Solving Strategy. We then planned how to implement our lessons with all 5th grade students to compare data across ELLs, EOs, and RFEPs. This took place January of 2014.
- We gathered and organized data, including student baseline scores, formative, and post-assessment scores to measure improvement. This took place from January 2014 thru March 2014.
- We met during grade-level meetings to debrief and discuss any improvements we needed to implement throughout this phase.
- We prepared a multi-grade level presentation to share our findings with our colleagues, where we would also ask them to begin implementing this intervention in their classrooms. It is important to note that because of the data we gathered in the first two Phases of this leadership project, and because we came at them already having implemented this strategy, not simply presenting a strategy that should work in theory, I was able to obtain their buy-in and thus their participation in my leadership project.
Phase III - Implementation phase in 4th and Special Day classes
- In this phase we finally gathered all we had learned in the previous cycles, we gathered our data, and
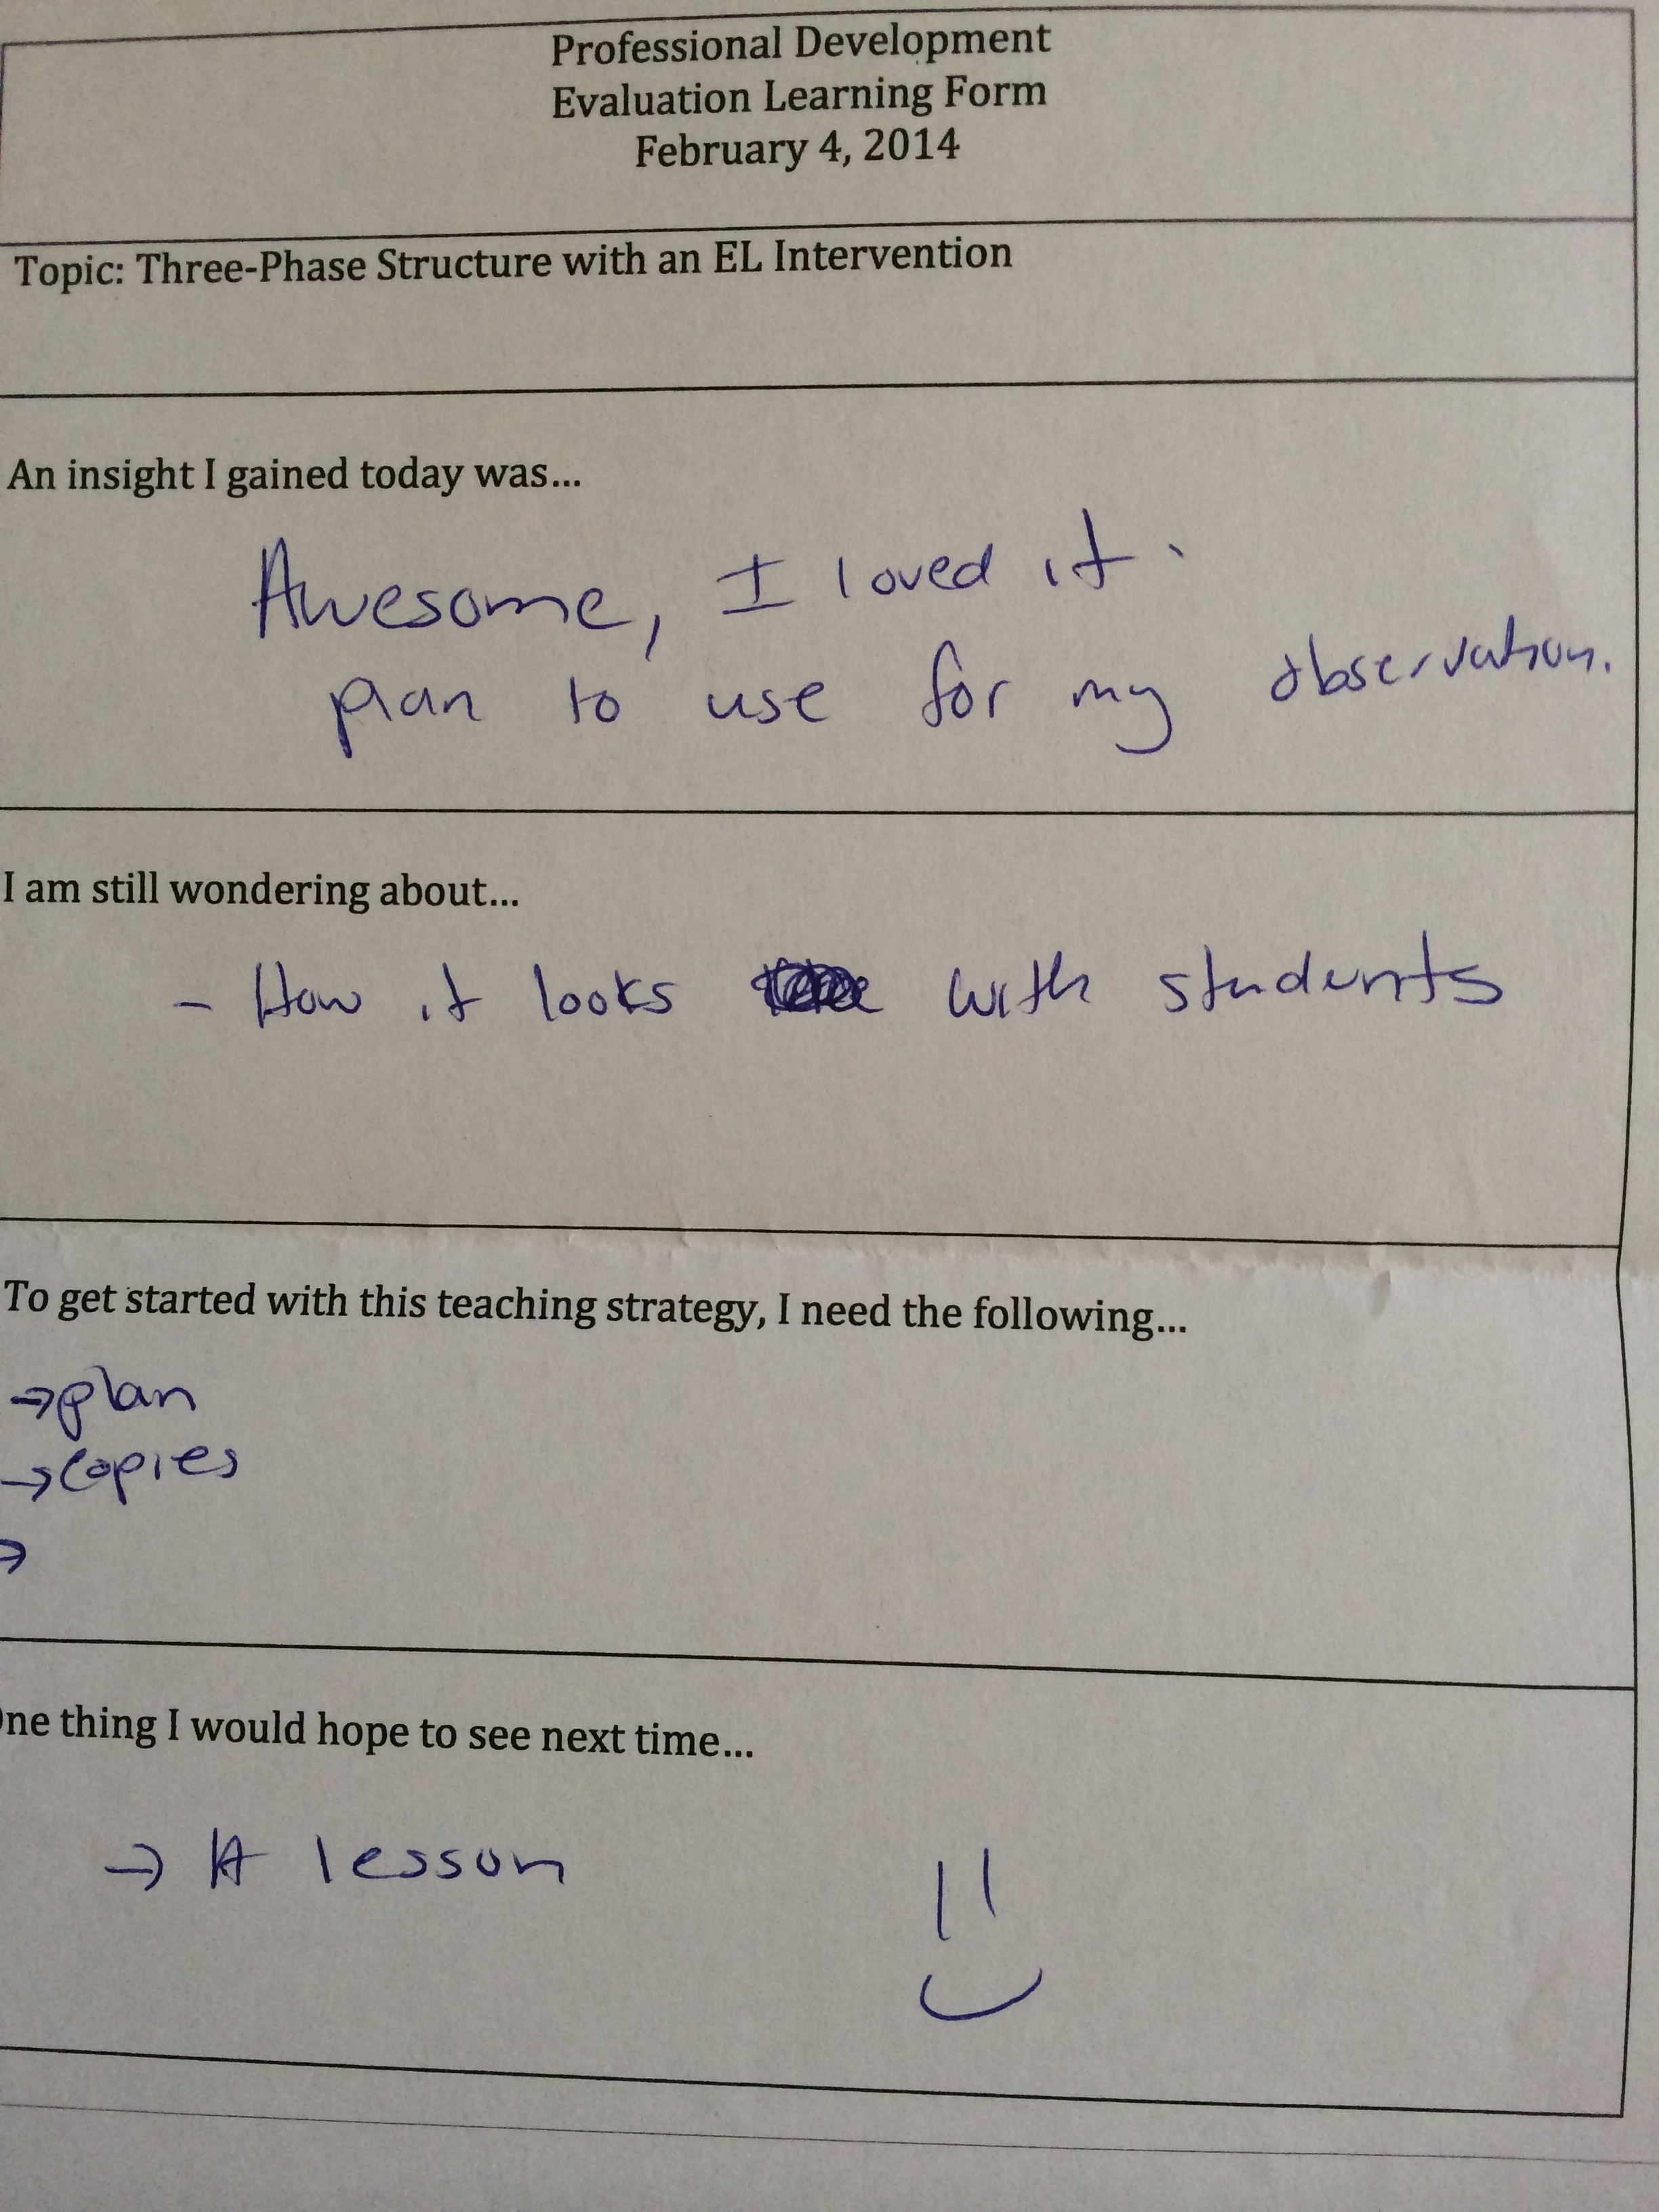
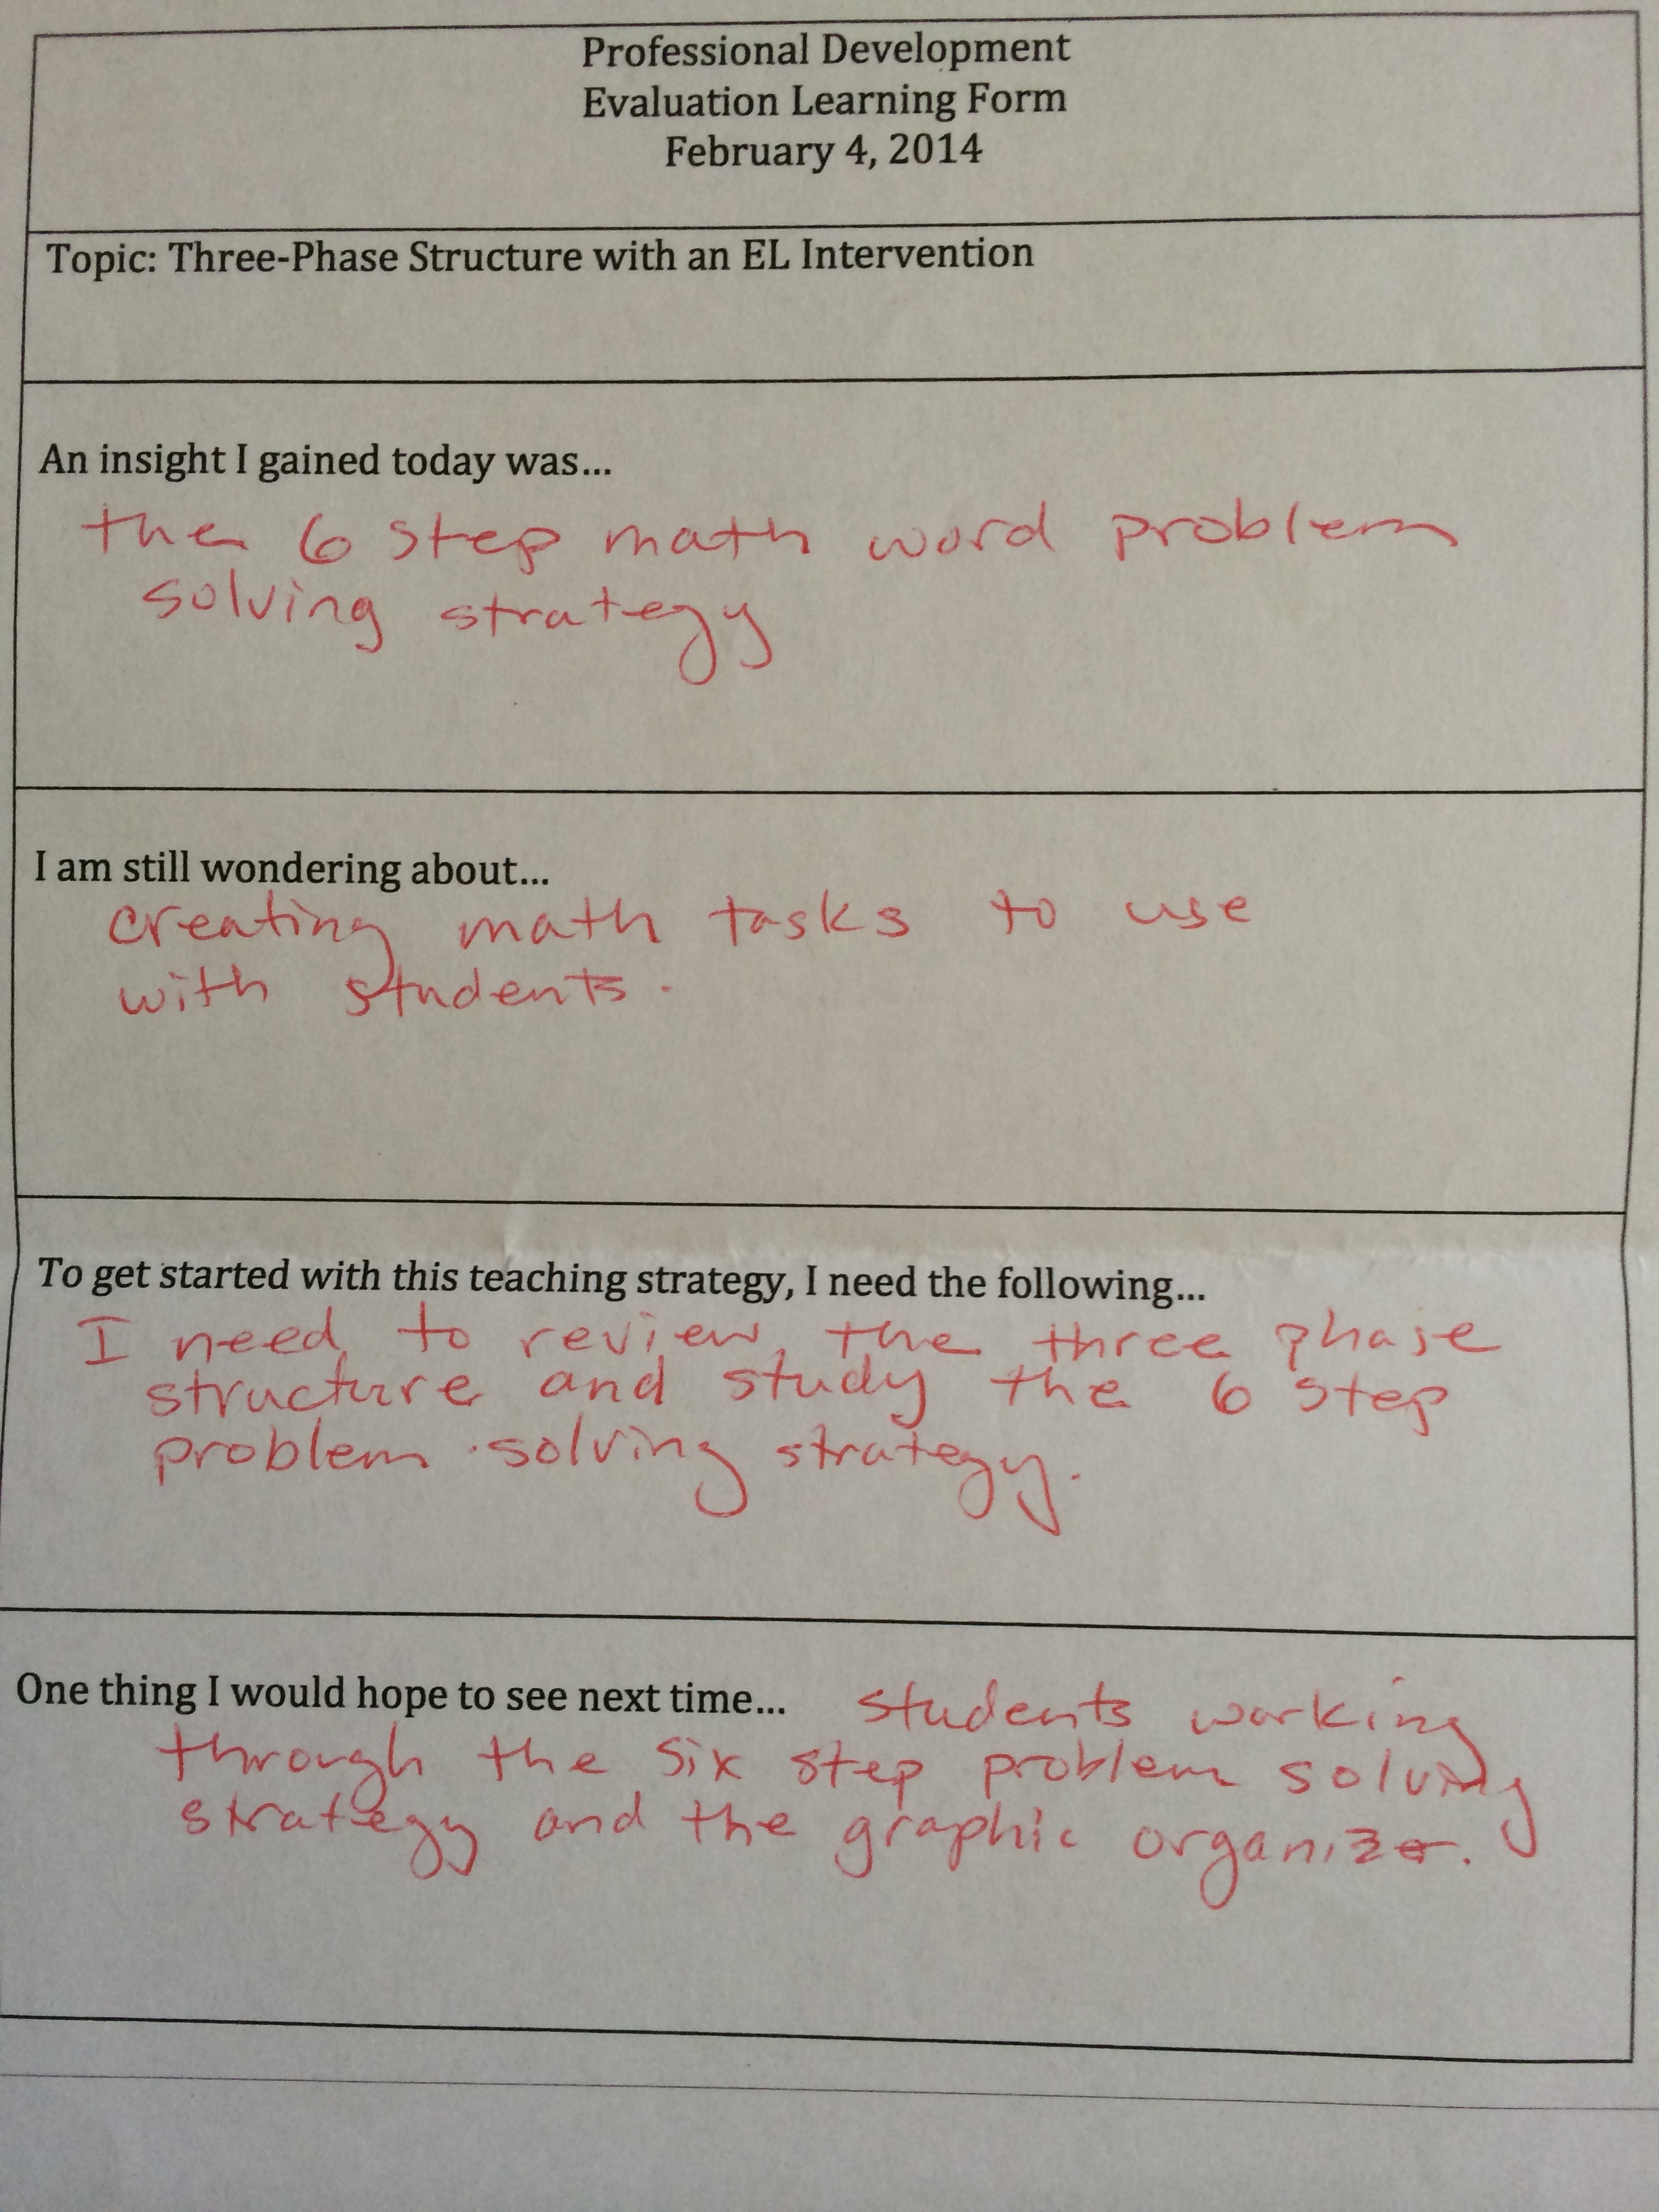
 we presented to the 4th grade and SDC teachers during a professional development that took place on Feb. 4th, 2014.
 - In this phase I used a peer-coaching model to introduce the intervention strategy. First, we presented the intervention strategy during a grade-level meeting. Then my colleague and I modeled the lessons for the 4th and SDC teachers in our respective classrooms. Then the teachers were asked to begin implementing lessons in their classrooms. This would help them prepare for Phase IV where we began to monitor student progress using a pre-assessment to establish baseline data and a post-assessment to measure growth.
- I monitored the implementation of the intervention provided in the professional developments by shadowing my principal. This took place the week of March 17th, 2014. Using formal and informal observations, I found evidence of implementation in four out of the five classrooms.
- I met with teachers to debrief how lessons were going and discuss any improvements or changes that needed to be made. This took place Feb. 25th, 2014, our principal's director attended the meeting.
- I created a Wordle document based on responses teachers gave when asked if they saw any improvement in their classrooms as a result of the intervention lessons. The teachers saw great improvement, not only in student work, but in positive student interaction as well.
Phase IV - 4th, 5th, and Special Day classes (114 students)
- Met with teachers to develop pre and post-assessments and to develop the intervention lessons to be used in this last PDSA Cycle. This took place March 18th, 2014.
- The 4th grade teachers administered the pre-assessment, they implemented the intervention lessons, and they administered the post-assessment. We were in the process of sitting down to score the assessments together, to ensure rater reliability, when the District pilot testing came upon us. The plans to sit down together to score had to be put on hold and they will form part of the next steps of this leadership project.
- In 5th grade grade we wanted to use the District's Second Performance Task as data for this last phase. We administered the second Performance Task and were quite pleased with the results. Those will be discussed below.
Teacher Survey Questions and Responses
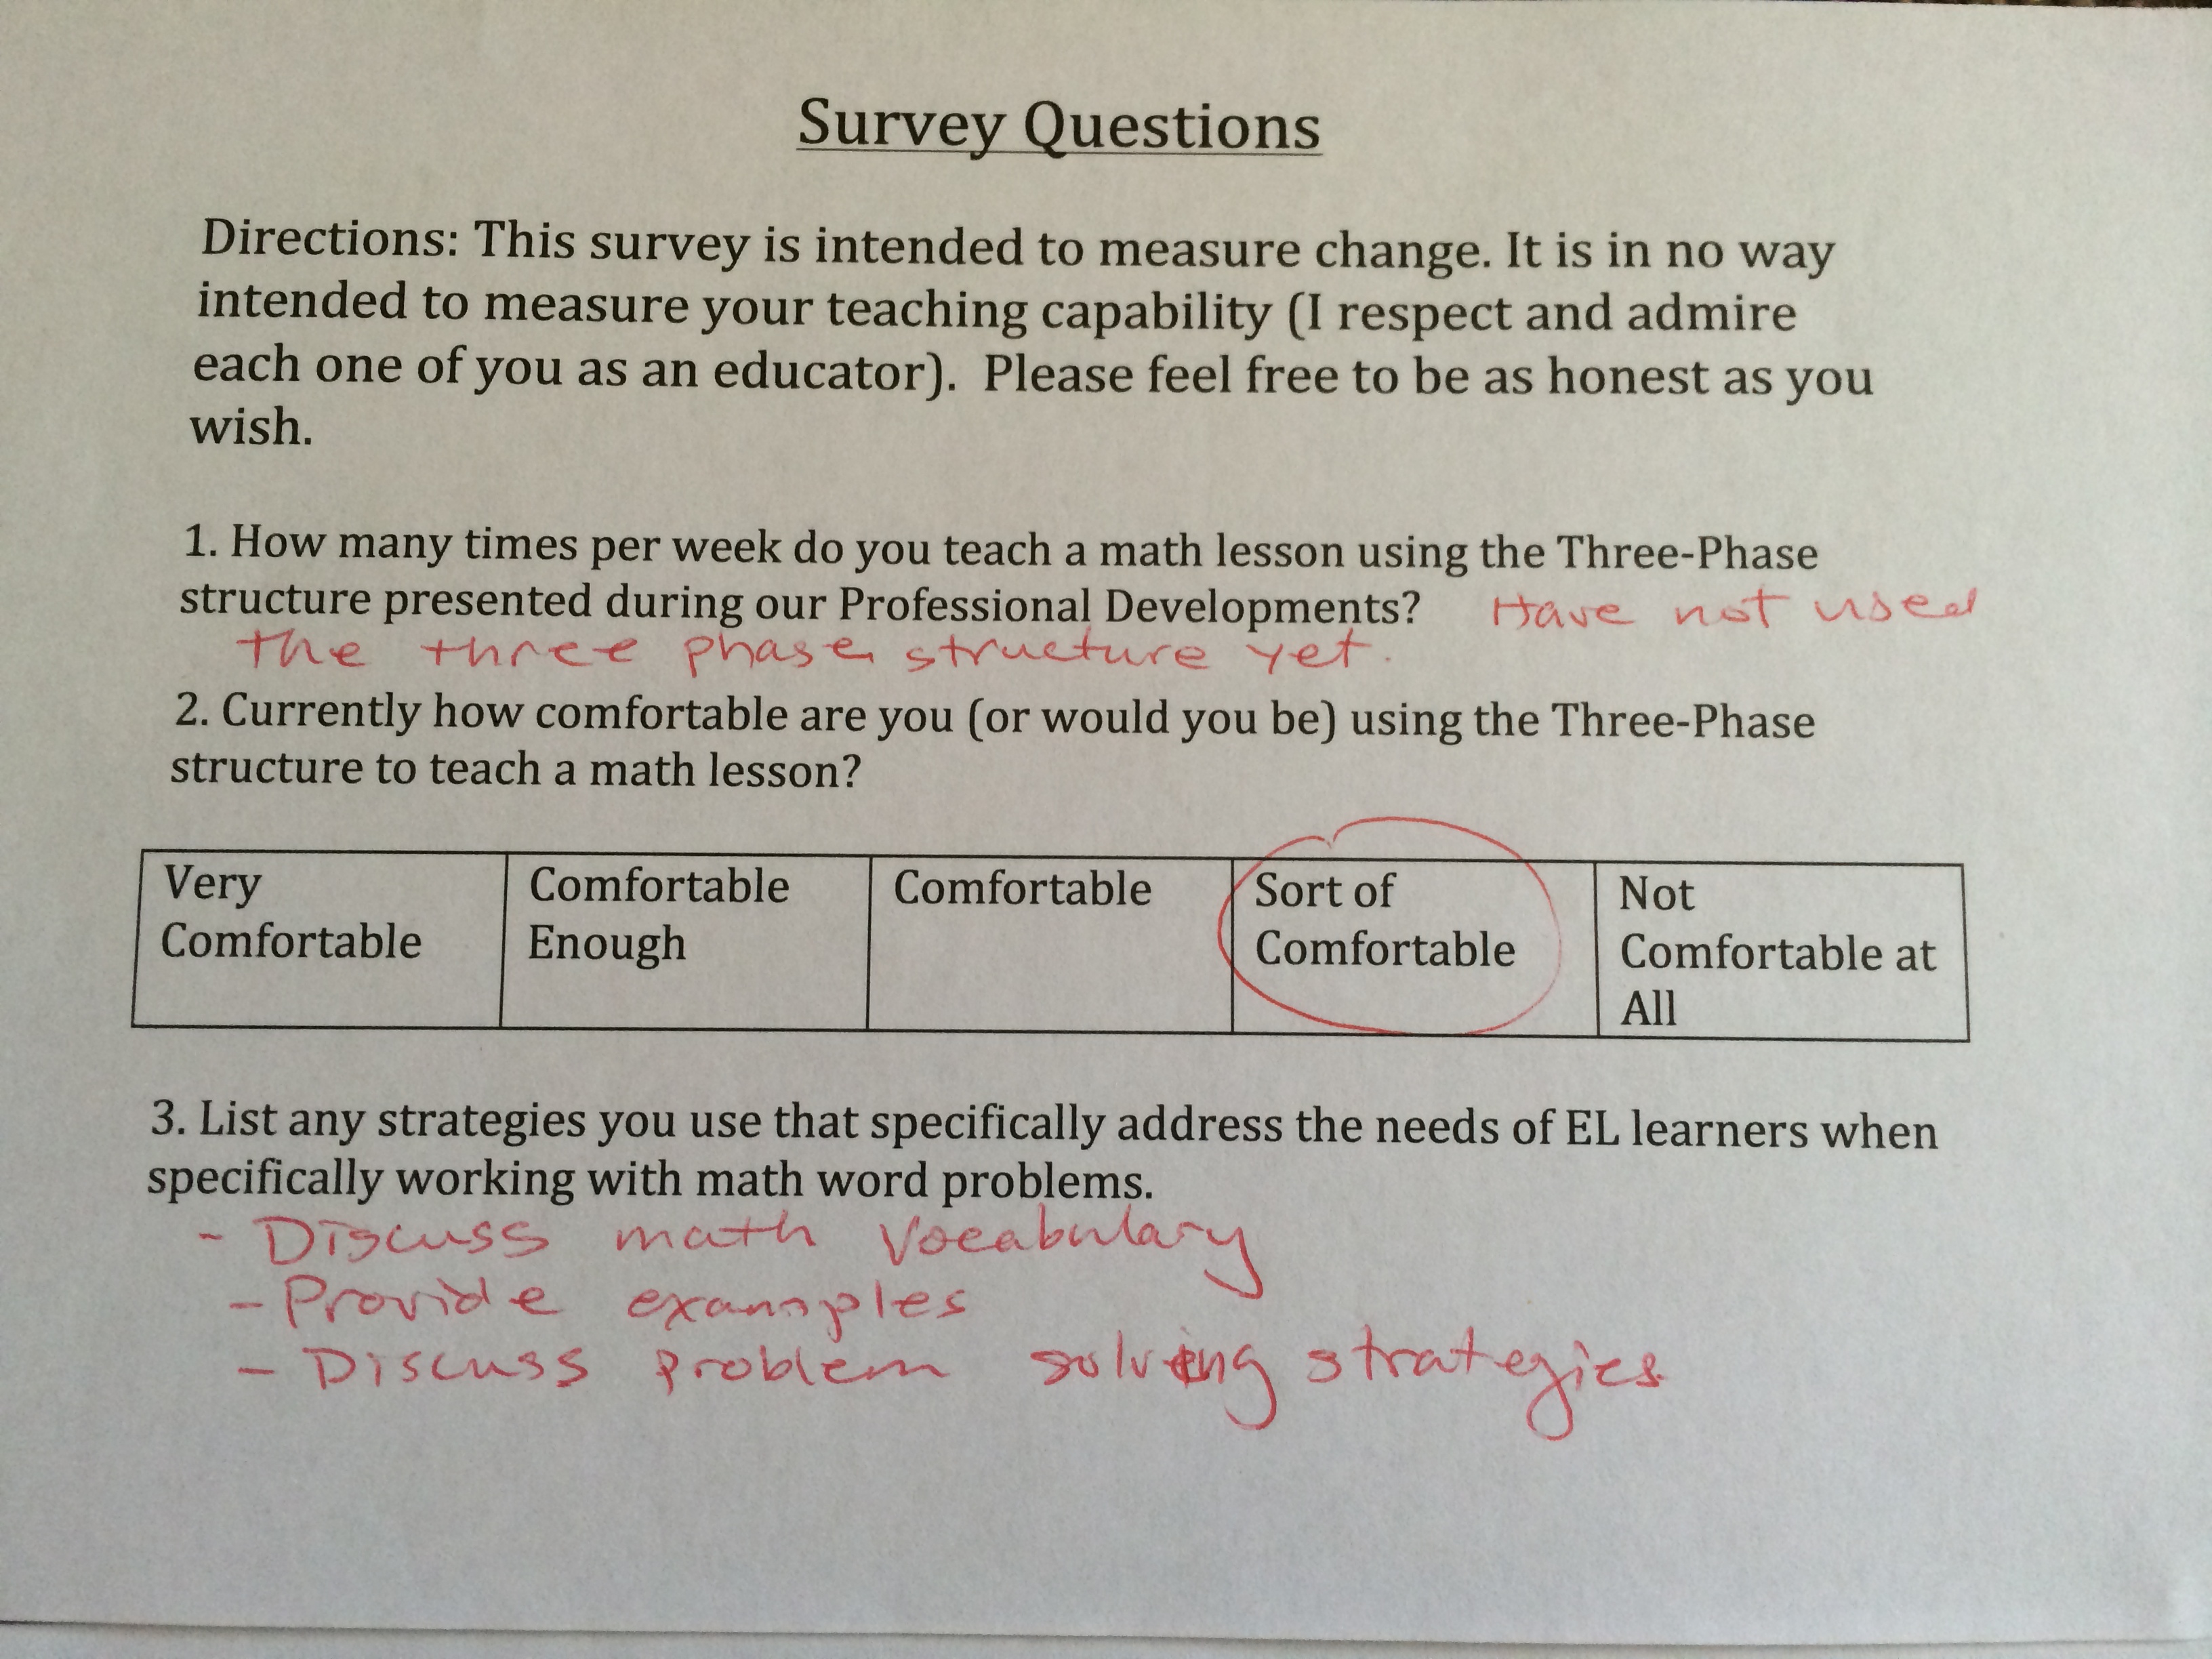
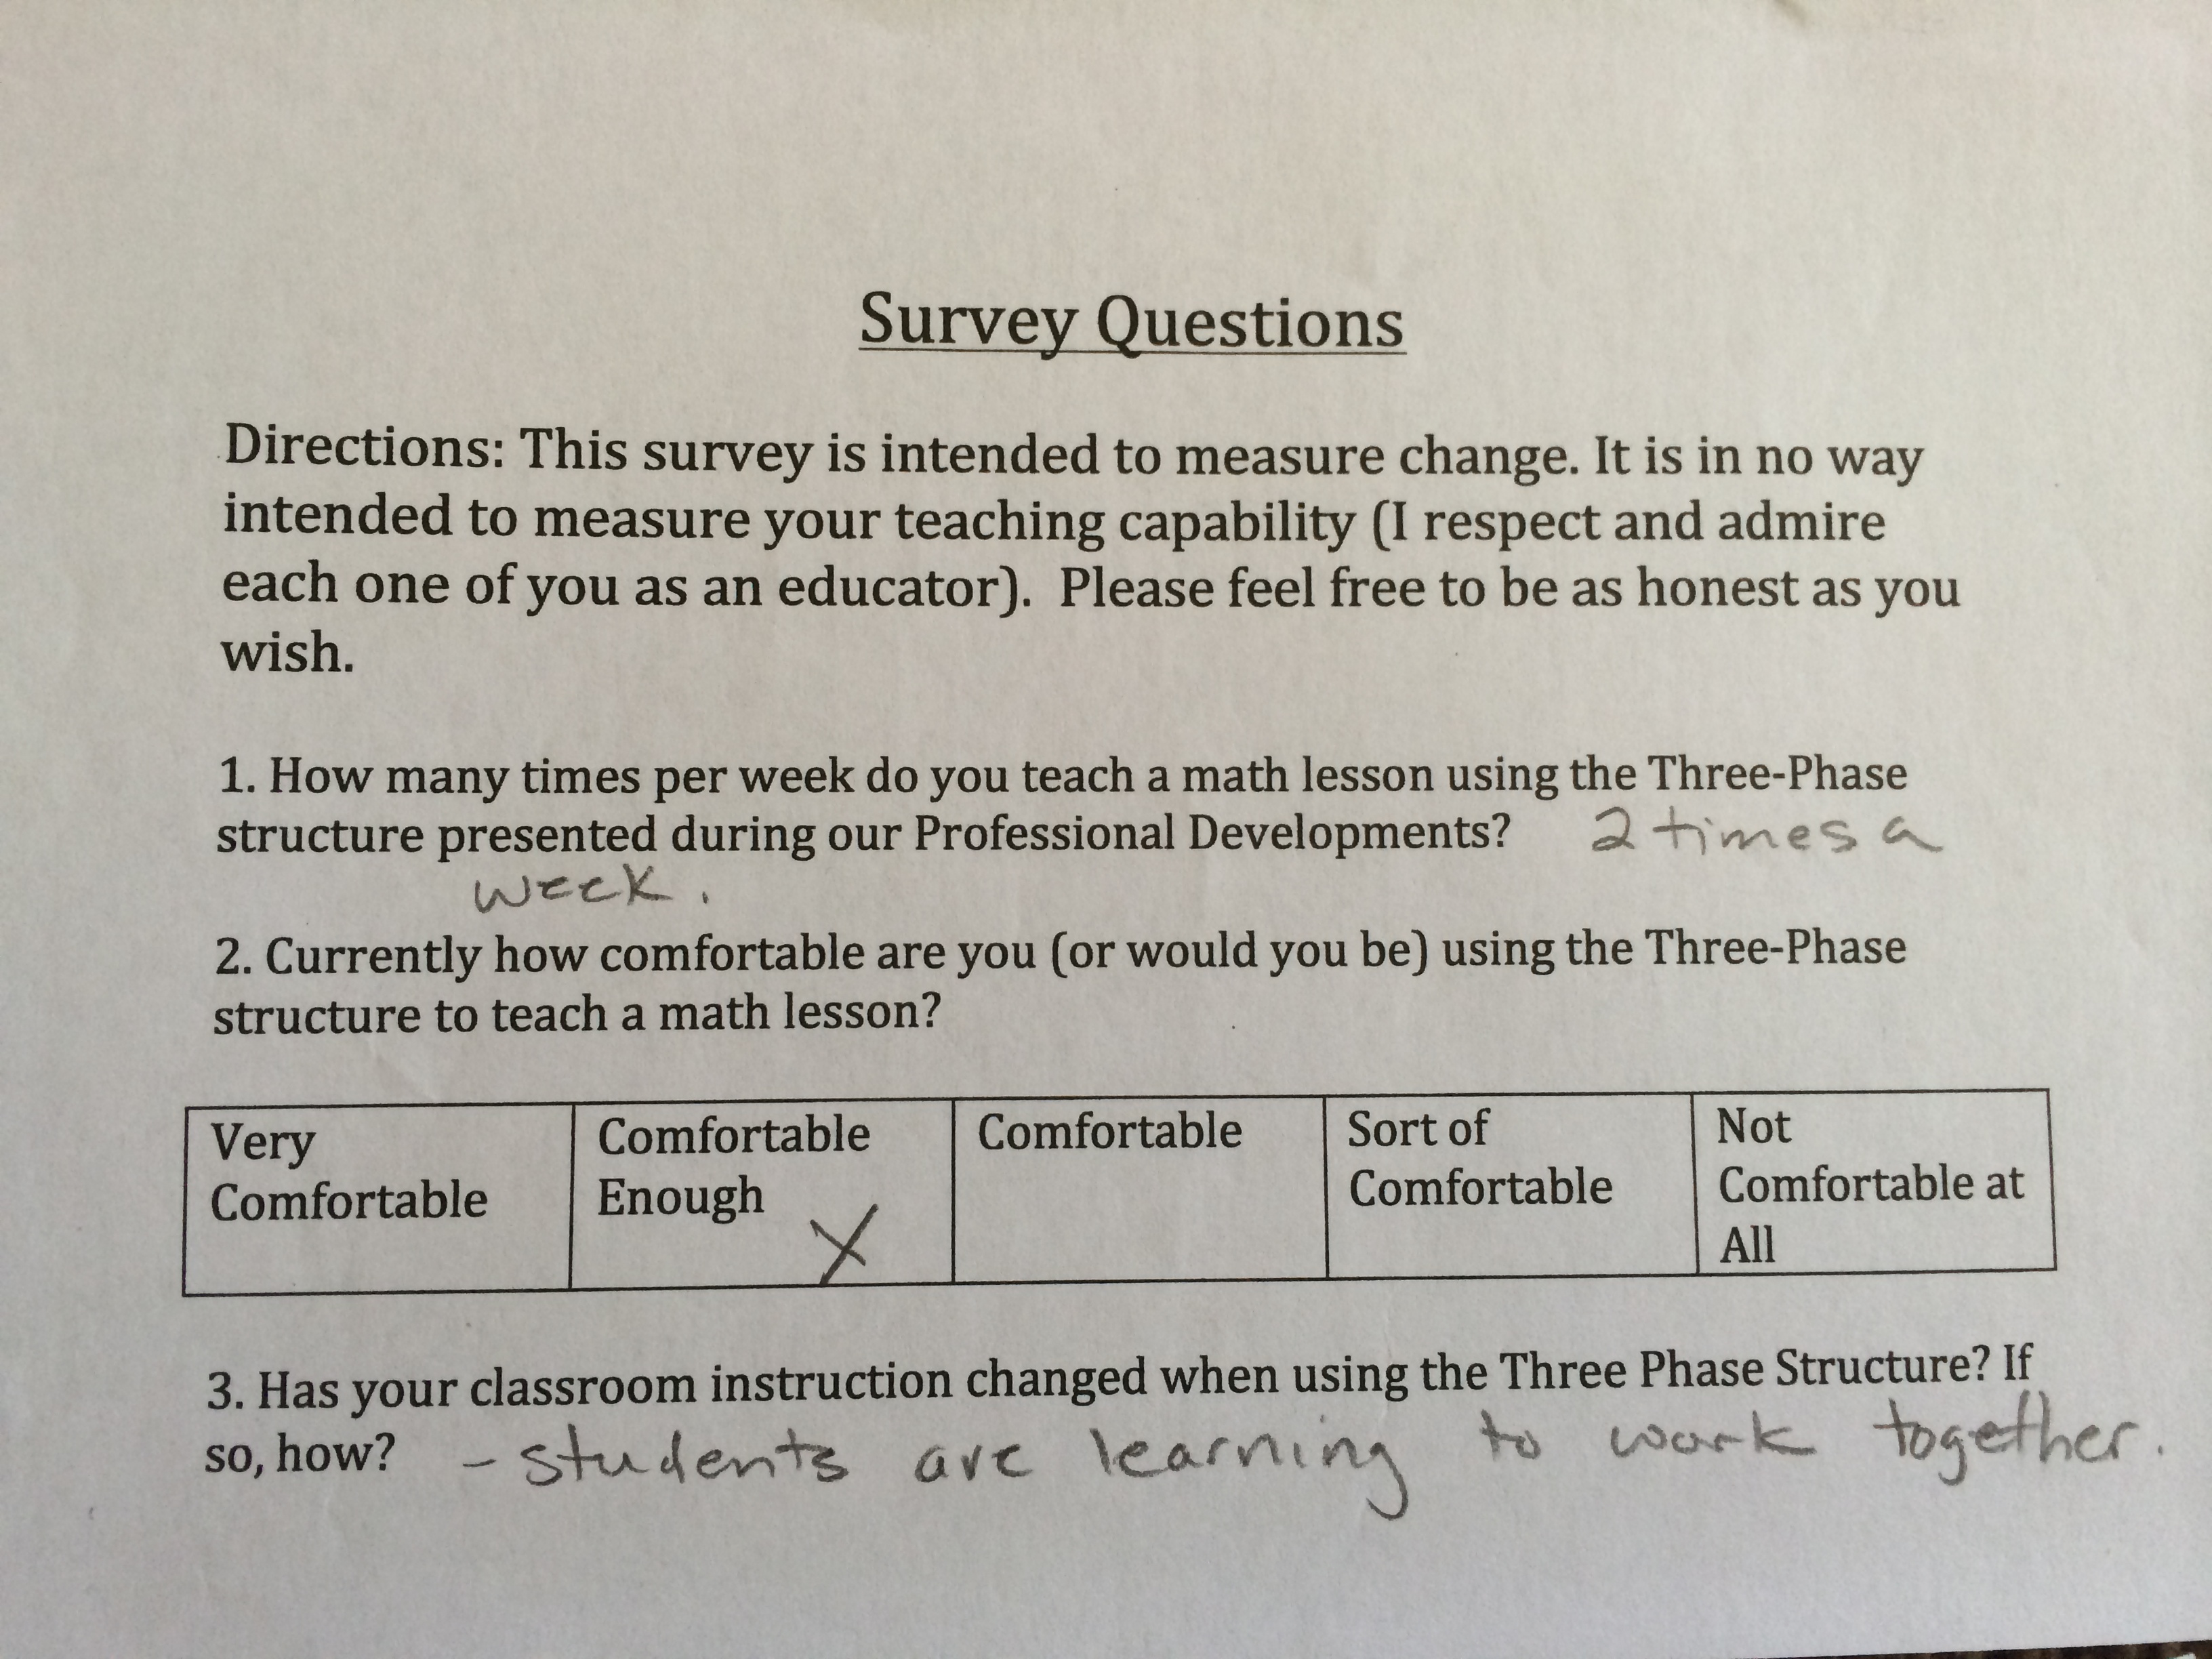
Participating teachers were asked a series of three questions, twice during their participation in my leadership project. These questions were administered at the beginning of Phase III and during Phase IV (samples of pre and post surveys can be found in the artifacts section below.) Teachers were asked:
1. How many times per week do you teach a math lesson using the Three-Phase structure presented during our Professional Developments?
Prior to Phase III teachers had not taught a lesson using the Three-Phase Structure. This was despite having it presented to them during a PD two months prior, and the principal requesting via the weekly school bulletin that they implement this strategy at least once a week.
The Post survey showed teachers were implementing this strategy two to three times per week. In 5th grade we were using it almost on a daily basis as a morning activity. This was definitely an improvement.
2. Currently how comfortable are you (or would you be) using the Three-Phase structure to teach a math lesson?
Despite not having taught any lessons all teachers noted they would feel comfortable implementing the Three-Phase Structure. I attribute this to the efficient job my colleague and I did in presenting the strategy during a Tuesday PD, teachers walked away from our PD feeling like this was something they could do in their classrooms.
In the post surveys teachers checked off they were comfortable to very comfortable using this Three-Phase Structure lesson format. Another big improvement.
3. (Pre) What sort of strategies do you currently use to help address the needs of EL learners?
Teachers listed the typical SDAIE strategies.
3. (Post) Has your classroom instruction changed when using the Three Phase Structure? If so, how?
This question differed in the pre and post surveys. I could not ask this question in the pre survey, yet I was curious to see how their classroom instruction would change. A change in classroom instruction has longer lasting implications versus simply using a strategy a few times as part of a project your colleague asked you to help him out with, and then not using it again.
Teacher responses showed that they felt more and more comfortable as they practiced the Three-Phase structure lessons in their classrooms. Further, the responses showed that as they felt more comfortable, they implemented more lessons.
An added bonus was that several teachers had begun to incorporate more group work in other areas of instruction. Here is where I feel I made the deepest impact. I provided a strategy that facilitated group work by providing a structured environment for this to happen. This led to teachers becoming more comfortable having students work in groups and then this group work format transferred over into other subject areas. I feel that working in groups can only benefit students, and thus, this was an unforeseen benefit for teacher's classroom instruction.
Outcomes/ Data
Phase I - After School Intervention Program (21 Students)
- 60% of ELs showed improvement
- 83% of EOs and RFEPs showed improvement
- 0% of all students scored proficient (70%) or above
Phase II - 5th Grade (58 students)
- District Performance Assessment I was used as a pre and post test
- 93% of ELs showed improvement
- 0% of ELs scored proficient or above
- 77% of EOs and RFEPs showed improvement
- 29% of EOs and RFEPs scored proficient or above
Phase III - Implementation Phase in 4th and SDC classes
- We introduced the intervention strategy to the 4th and SDC teachers.
- 4 out of the 5 classrooms were implementing the strategy to varying degrees according to formal and informal observations conducted.
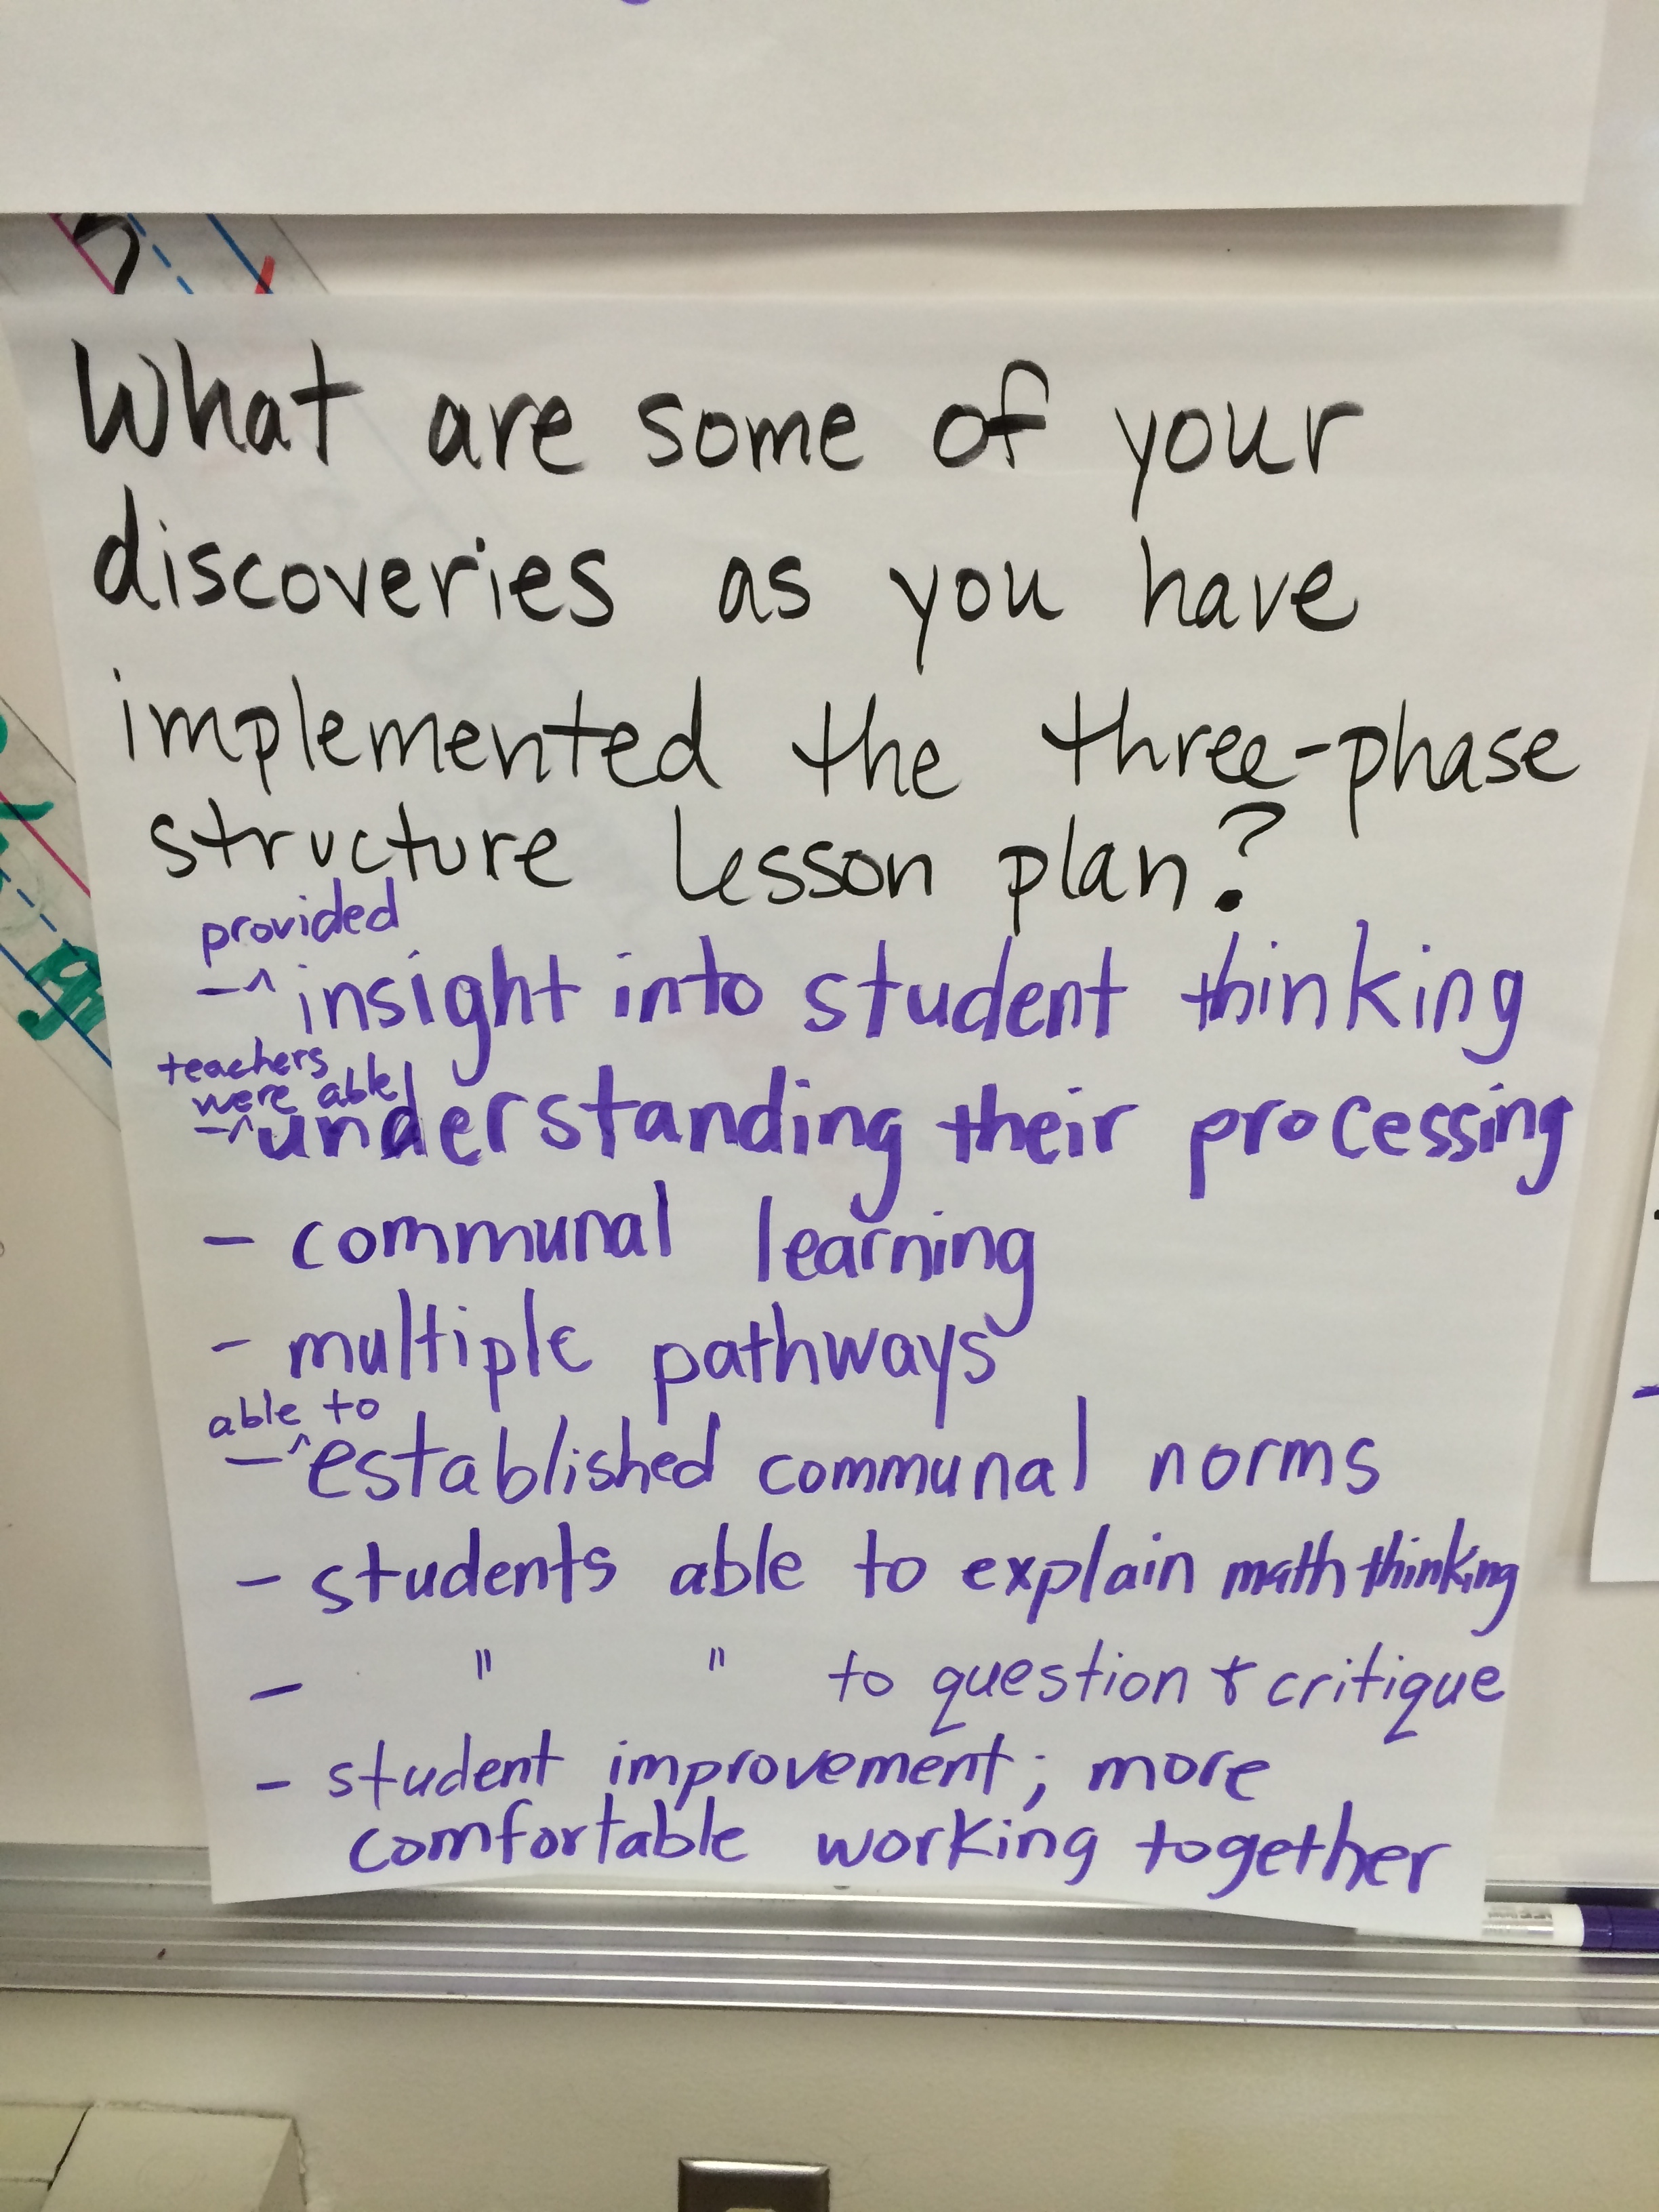
- A debriefing session during this Phase also demonstrated teachers were in fact becoming more comfortable with the Three Phase Structure and the intervention strategy. This encouraged us to continue on into Phase IV.
Phase IV - 4th and 5th Grade Data (98 students)
Note: Testing demands placed on the teachers due to District Smarter Balance Testing prevented us from being able to sit down to score student assessments collaboratively to ensure rater reliability. 4th grade data will be uploaded as soon as it is scored.
My colleague and I were able to find time to complete the 5th grade portion, since our principal wanted to see the results of the District's Second Performance Assessment. Also, we were both curious to see how our students would do on the assessment, and we were beyond pleased with the results shown below.
5th Grade
- 88% of ELs showed improvement
- 75% of ELs scored proficient or above
- 95% of EOs and RFEPs showed improvement
- 90% of EOs and RFEPs scored proficient or above
4th Grade
- Data results pending scoring
Reflections
The data ended up showing that we in fact positively affected student’s ability to solve performance task type questions. In 5th grade, where fidelity to the intervention was the highest, according to the data gathered from the District’s Second Math Performance Assessment, there was significant improvement in all students’ ability to solve performance task type questions.
Throughout all phases of my leadership project, the data continued to show that all students, including ELs, were getting better at doing what was being asked of them by the Common Core Math Practices 1 and 3. They were getting better at explaining and justifying their math reasoning, and they were getting better at critiquing the math reasoning of their peers.
Furthermore, in regards to long-term outcomes, the peer-coaching model I used to present the intervention I researched has been incorporated into our school’s Single Plan for Student Achievement. This means that even if I leave the school, systems have been put in place where some of the work I’ve begun will continue to be used to help our students, specifically in the area of Math, for the next two years, at least. This really does make all the hard work worth it.
This leadership activity helped me grow as a leader. I got the opportunity to demo lessons, lead grade-levels, and present to an audience of teachers, administrators, and district personnel. It also exposed me to the peer-coaching model and the many benefits that come with it. In this model my peers did not see me as a graduate student imposing this leadership project on them. My peers saw me as a facilitator of learning. I had this strategy that was working in 5th grade, I had the data to show it, and this small group of teachers came along with me on this learning walk. I am tremendously grateful to them for the learning they allowed to happen amongst us all.
Future Implications
It is important to note that all pre and post-assessments were based on Smarter Balance Consortium performance task type questions. This is the company that will be responsible for developing the assessments LAUSD will be using to formally monitor student progress. We did not water down the curriculum to obtain favorable results. We began with small steps, that led to small improvements. We  then took bigger steps that led to bigger improvements. I will continue to advocate for all marginalized students. This leadership project helped to further cement the idea in my head that all students have the ability to learn at high levels of reasoning.
Since the data showed improvement at each Phase of implementation, next steps tell us that we should try and implement the strategy school wide. In fact, the peer coaching model I used to introduce this strategy to the 4th and SDC teachers has been written into our Single Plan for Student Achievement. For the next two years at least, the peer coaching model I introduced in my leadership project will be implemented school wide.
Connection to CPSELs
- CPSEL #1 - Through the various multi- grade-level meetings I shared with teachers the district's vision of helping all students to be college and career ready by the time they leave our public school system, via the Common Core State Standards. We used data to inform our teaching practices and to make changes where necessary to help students access the learning going on.
- CPSEL #2 – As grade-level chair I helped promote equity, fairness, and respect among the members of the school community. I provided opportunities for all members of the school community to develop and use skills in collaboration. I distributed leadership, and I shared responsibility. Professional Development was an opportunity to address the immediate needs of the school community. I provided staff with tools to work more effectively with one another to improve student learning.
- CPSEL #3 - We collaborated to create an intervention strategy that would facilitate student learning. It would create an atmosphere that would encourage student interaction and learning.
- CPSEL #4 - We collaborated and responded to the diverse interests and needs of our students through a series of improvement cycles.
- CPSEL #5 - In working with my colleagues to plan out the various lessons, and assessments we would use, and using a peer-coaching model, I feel I helped my colleagues grow as educators. My 5th grade colleague led grade-level meetings we facilitated with 4th grade and the SDC teachers, something she had not attempted previously.
Supporting Documents/ Artifacts
- Math Practices
- Three Phase Structure
- 6-step Math Word Problem Solving Strategy
- Student Rubric
- Student Template
- Phase I Data
- Phase II Data
- Phase III Agenda and Sign-in
- Phase III Teacher Survey (1) (pre)
- Phase III Teacher Survey (2) (pre)
- Phase III Teacher Evaluation of PD (1)
- Phase IIITeacher Evaluation of PD (2)
- Shadowing My Principal: Observations Schedule
- Debriefing Session Agenda and Sign-in
- Debriefing Session Growth Chart
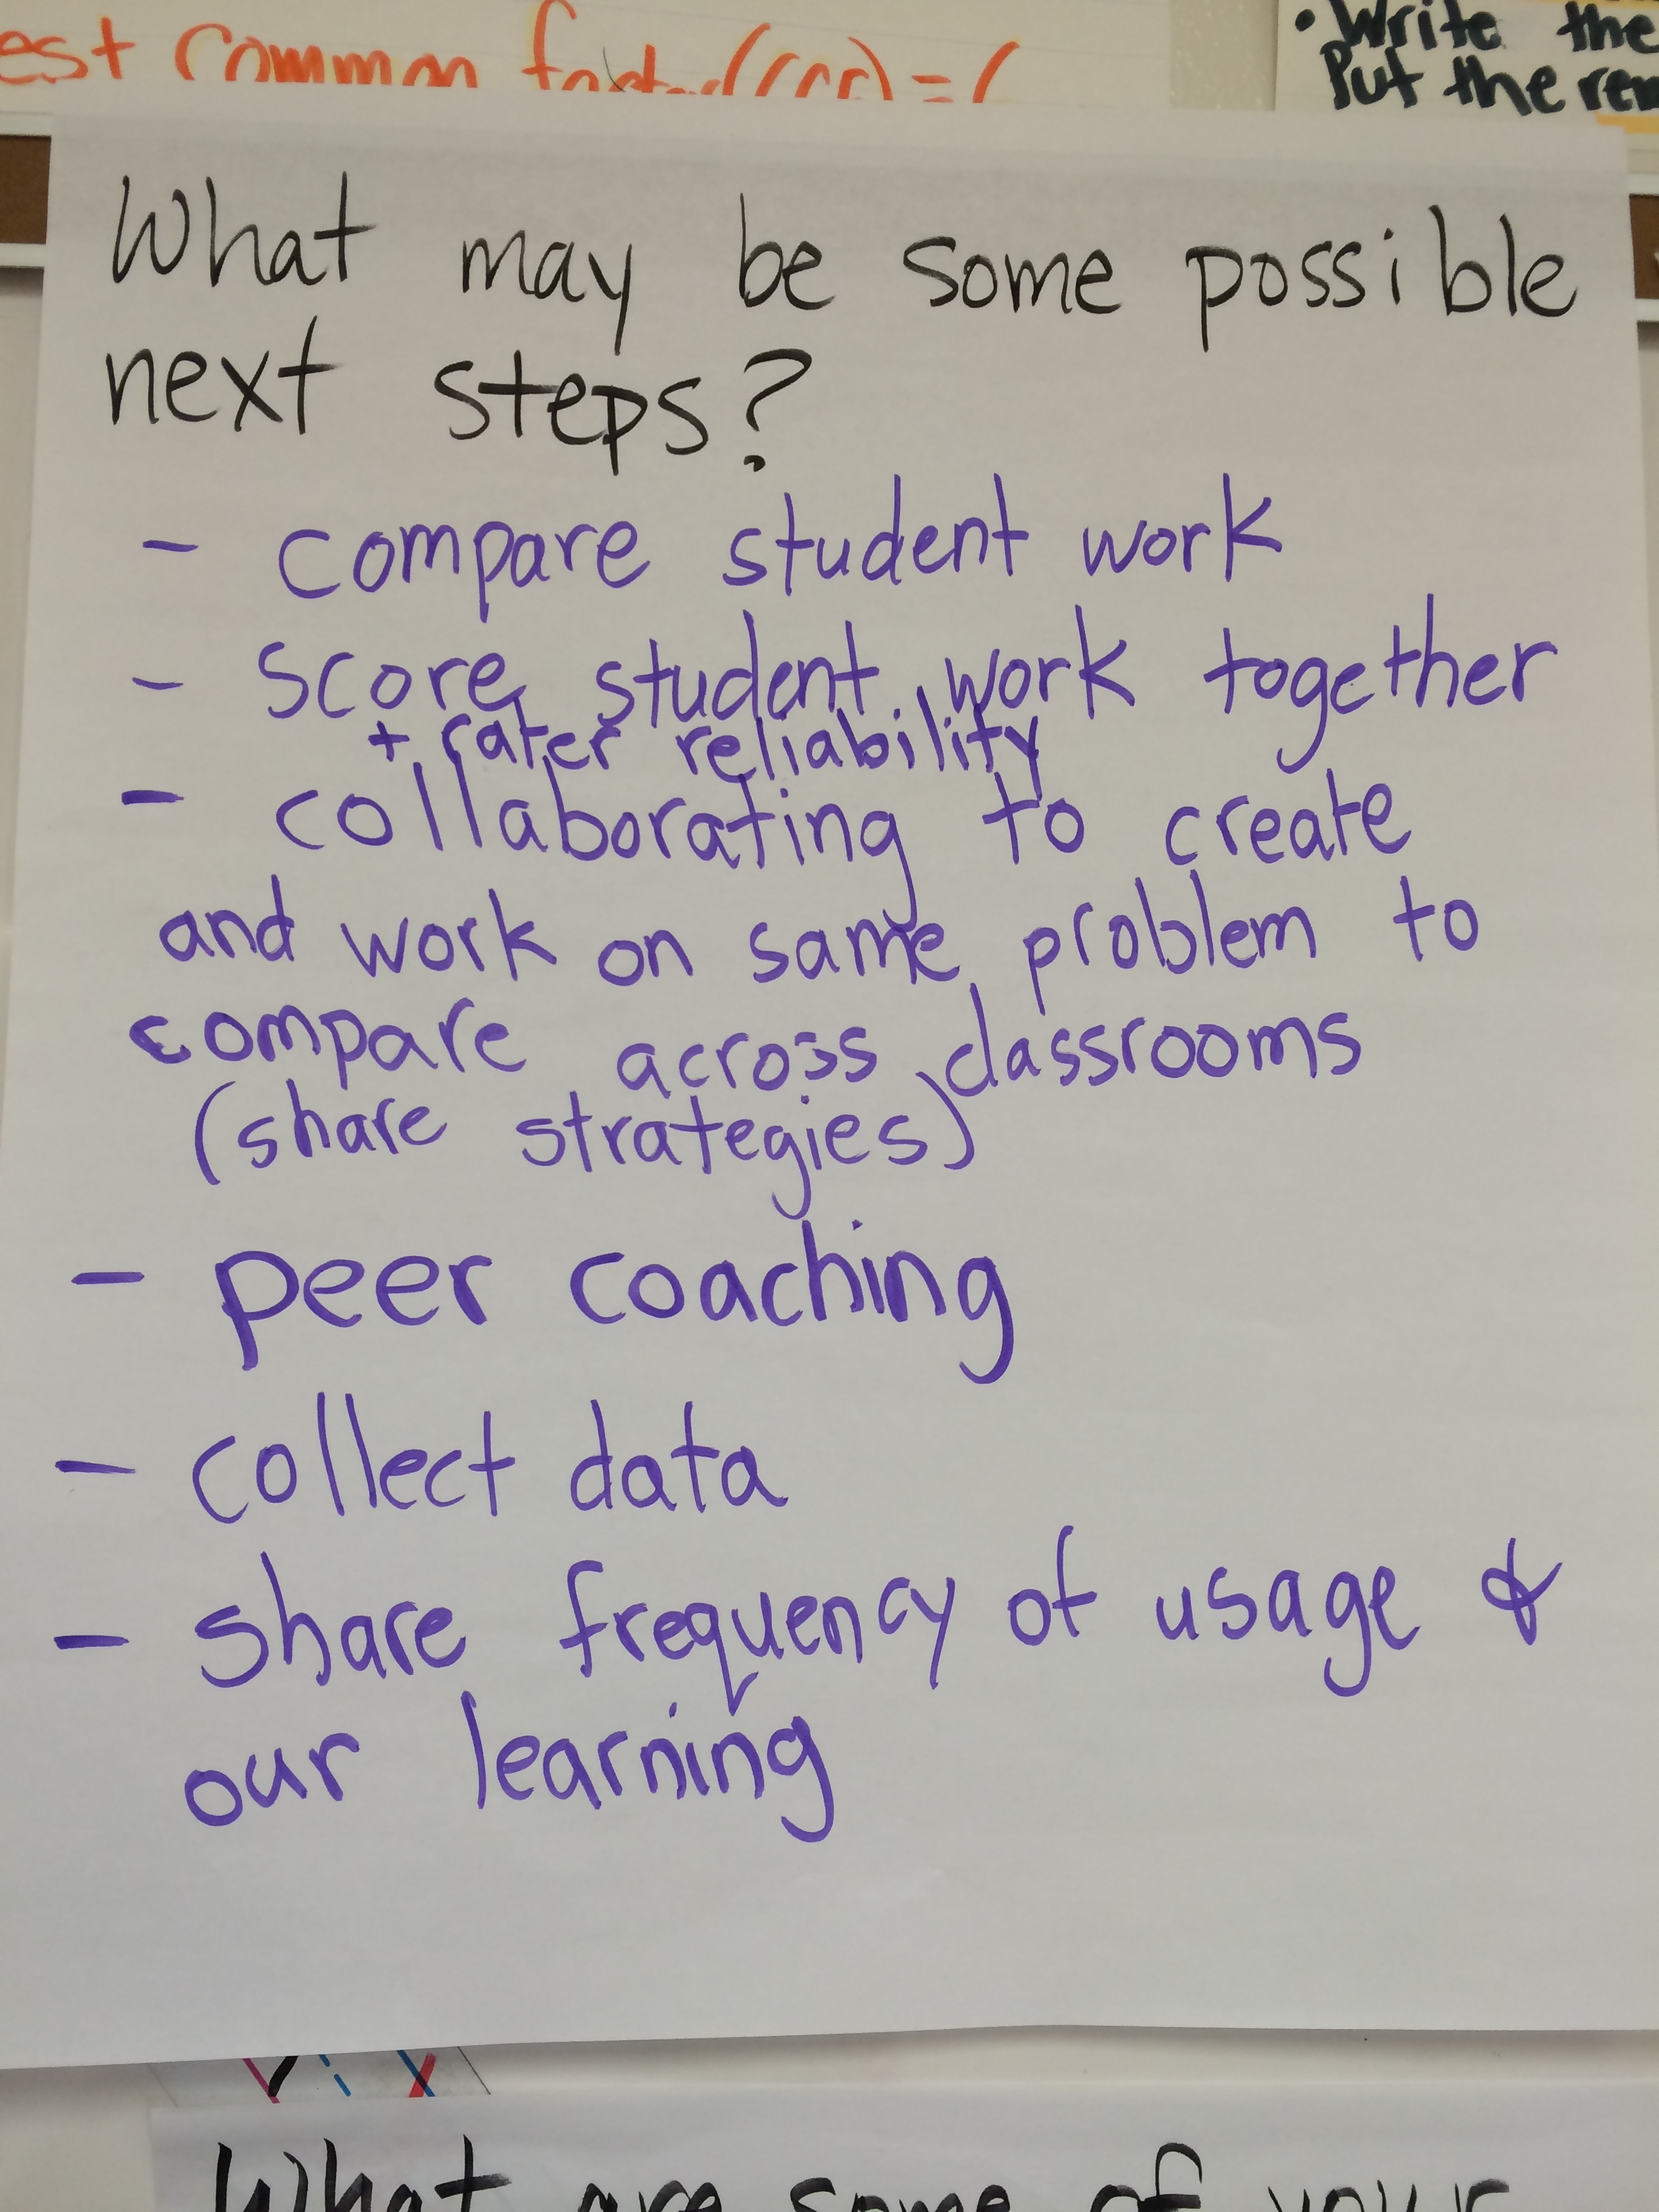
- Debriefing Session Next Steps Chart
- Phase IV Agenda and Sign-in
- Phase IV Teacher Survey (1) (post)
- Phase IV Teacher Survey (2) (post)
- Phase IV Data
