Leadership Project: Math Attitudes Along Gender Lines
Project Overview
For my Leadership Project, I wanted to explore differences between adolescent girls and boys in terms of their attitudes toward math and self-assessments of their own math abilities. Before beginning my project, I researched adolescent math ability in terms of gender, and found that some studies show that girls perform better in math classes when there are many opportunities for collaboration, and when inquiry-based, constructivist teaching methods are employed in the classroom. As a math teacher with over ten years of classroom experience, this information reinforced what I saw in my own classes: girls feel more empowered when the instruction is more student-centered and less focused on direct instruction and note-taking. I decided to conduct a survey of middle school and high school students attending a variety LAUSD schools, to see if these students' attitudes toward math reflect the existing data and my own informal observations. My goal was to use this information to inform my own teaching, and perhaps even professional development on a district-wide level. Below is a logic model that shows my process:
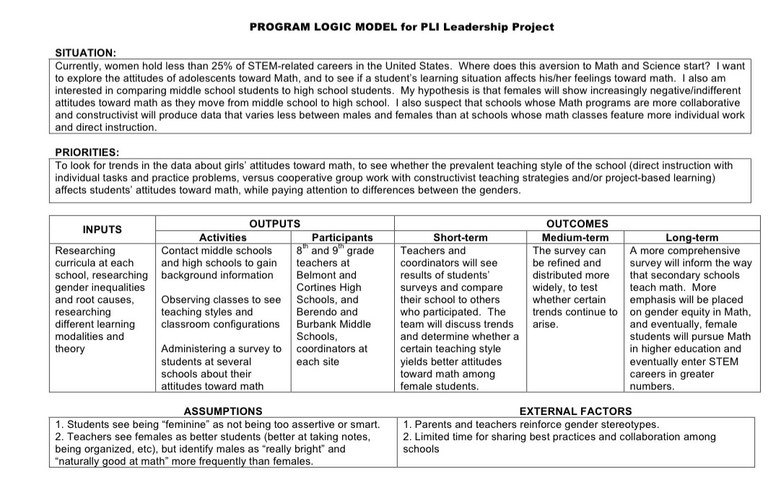
I chose two middle schools (Berendo and Luther Burbank) and two high schools (Belmont and Ramon Cortines) for this study. I focused on eighth and ninth graders only. Before administering the student survey, I met with department chairs, teachers, and coordinators at each site to explain my project to them and to get a better understanding of the schools' math programs. I observed several classrooms at each of the four sites so that I could see for myself how each school "does math."
 The student body at Berendo, located in LA's "Byzantine-Latino Quarter" near Downtown, is over 90% Latino, and all qualify for free and reduced lunch. Berendo uses the Glencoe California Math textbook, and has a fairly even mix of male and female math teachers. Some teachers arrange their rooms in rows of single desks, while others have students working in pairs or groups of four. Most classes had twenty-four to thirty students. Based on my classroom observations, the teaching style was varied: some classrooms featured lots of collaboration and inquiry, while others were more teacher-directed, with ample direct instruction.

Burbank Middle School in Highland Park has a majority Latino population (around 90%), and all students qualify for free and reduced lunch. At Burbank, all of the math teachers use the College Preparatory Math (CPM) textbook, which focuses on group collaboration and is rooted in constructivist theory. The vast majority of the math teachers are female (all of the classrooms that completed the survey had female math teachers), and the desks are always arranged in groups of four. Their classes are large: most rooms have over forty students. In my observations, I saw that the students had many opportunities to collaborate and use manipulatives.

Both high schools have relatively small ninth grade classes, with the number of students ranging from twenty to twenty-eight. Ramon Cortines High School in Downtown Los Angeles has a performing arts focus, and the Instructional Specialist admitted that "math is not usually our students' strength." Like Burbank, Cortines adopted the CPM textbook series, and the students' desks are arranged in groups of four; however, Cortines' math department is fairly evenly staffed with male and female teachers. Of all four schools, Cortines boasts the most diverse student body, with about 70% Latino students, and the remaining 30% a fairly even mix of Black, White and Asian. About three-quarters of Cortines students qualify for free and reduced lunch.
 Located within the same zone of choice as Cortines, Belmont has a very high Latino population (over 95%), and all students qualify for free and reduced lunch. Belmont uses the Glencoe Algebra 1 textbook, and the teachers teach in a very traditional way. The desks are usually arranged in rows, and the majority of lessons I observed had a lot of direct instruction and note-taking. Also, the Algebra 1 teachers are predominantly male, and, with the exception of a very small (6-student) newcomer class that has a female teacher, all of the teachers whose classes completed the survey are male.
When I discussed my project with the teachers and out-of-classroom staffs of each school, many pointed out that the majority of their "really good students" are girls, and that they did not think that girls were less engaged or more resistant toward math than boys. The teachers all predicted that the students' attitudes toward math would not vary greatly between female and male students. In fact, many predicted that the girls would be more open to pursuing math in the future than the boys.
Evolution of the Project
During the course of the school year, my plan for my Leadership Project changed significantly because I left the classroom for a coaching position. While I always intended to focus on girls and math, I originally planned on facilitating professional development sessions to establish Professional Learning Communities of teachers in a family of schools. However, when I became a coach, I worked with different schools and it was not possible for me to continue to deliver professional development with my former school, which lies in a different LAUSD Educational Service Center. Furthermore, although part of my new position involved training teachers, I had to follow a District-developed script and was not allowed to develop my own Professional Development sessions to bring to the school sites for which I was responsible. My new supervisor, Mara Simmons, suggested that I examine data from different schools instead, so I took her advice and changed my project to be more research-oriented. Since the beginning of my data collection process, I now have a new supervisor, Don Wilson, who has been very supportive of the work I began with Mara. Although this project was different than my initial idea, I believe that the data I collected is interesting and thought-provoking. As I share it with teachers, many are interested in conducting similar surveys on a larger scale. I hope that the work I have done can at least start discussions about addressing the needs of girls in math, and that my work will inspire my colleagues to continue to investigate the causes of male domination in STEM careers.
Data
The data I collected for my Leadership Project comes from anonymous student surveys. For each of the four school sites, I collected data from at least 100 students (most sites had closer to 200 participants). The students' teachers administered the survey electronically via Google Forms, and I compiled the data. The survey contained basic multiple-choice information about the students' current grade level, school, gender, and the gender of their math teachers to gather background data. To gather information about students' feelings toward Math, I used a Likert Scale. Students read statements, and had to choose one of four options: Strongly Agree, Agree, Disagree, or Strongly Disagree. I chose to omit a "Neutral" option so that students had no choice but to report positively or negatively about their Math attitudes. One statement that students responded to was "I am good at math." Their responses are displayed below.

This data shows us that, in middle school, both genders reported generally positive responses to this question: roughly 75% of boys and girls either agreed or strongly agreed that they are good at math. Burbank's data for both genders shows that fewer students feel that they are good at math; however, this may be due to their extremely large class sizes. The data for high schools is more varied. At Cortines (the school with more affluent students and a performing arts focus whose Instructional Specialist admitted that math is not a strength for most students), students reported the highest levels of math confidence, with about 90% of girls believing that they are good at math. At Belmont, however, we see the largest disparity between the genders, with about 75% of boys agreeing or strongly agreeing that they are good at math, but only slightly more than half of girls reporting that they are good at math. This is significant because Belmont's math teachers are overwhelmingly male, and the teaching style is more traditional. This data suggests that these factors can negatively affect girls' confidence levels toward math.
Next, students considered the statement, "Math is one of my favorite subjects."
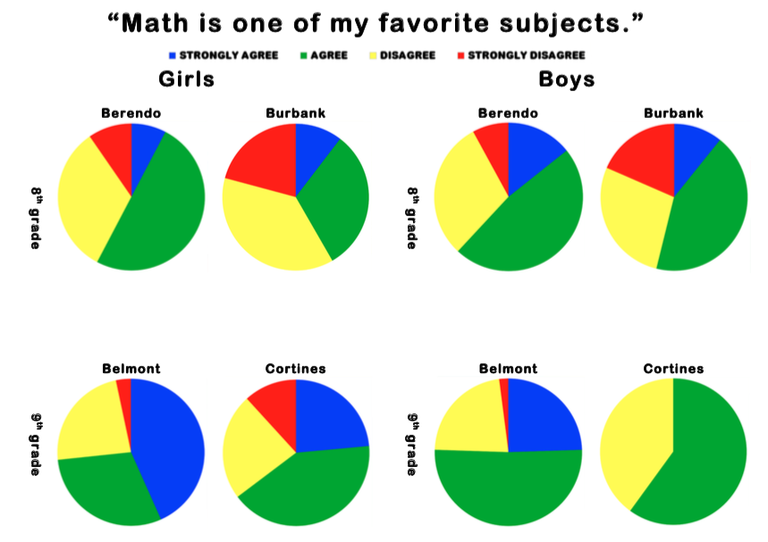
This data also shows similar responses for both genders at each school surveyed. With the exception of Burbank girls, more than half of the respondents in each sub-group agreed or strongly agreed that math is one of their favorite subjects. Also, of all of the schools in the study, Belmont ninth grade students as a group like math the most. This point surprised me because, while roughly 75% of boys and girls at Belmont report math to be one of their favorite subjects, significantly fewer girls than boys at Belmont agreed that they were good at math (about 55% of girls, compared to about 75% of boys).
Students tend to be interested in college majors that reflect their strengths, so given the above data, I expected similar data trends in answers to the next survey statement: "I would like to major in math in college." While I realize that not all students who are good at math would choose math for their major, I expected the gender-specific data to be roughly proportional to the charts above. This hypothesis proved to be incorrect.
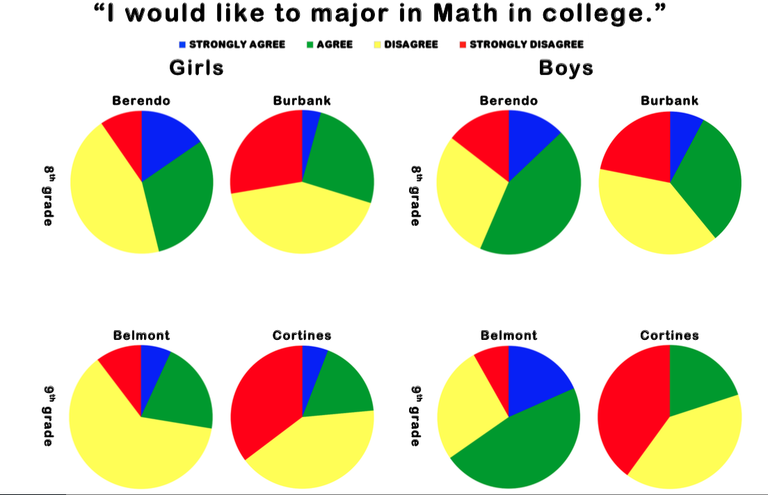 Of all the data I collected in my survey, the responses to this prompt were the most startling to me. I expected the Cortines students (both boys and girls) to be less interested in majoring in math in college, since the focus of that school is on the Arts. However, I found that, although more Cortines students strongly disagreed with the statement, the number of students who had negative responses (either "Strongly Disagree" or "Disagree") - about 80% of them - was similar to Burbank's data for both genders and Belmont's data for girls. Of all schools and subgroups polled, the boys at Belmont were most interested in majoring in math in college, with about 65% of respondents agreeing or strongly agreeing with the statement. Belmont's data also differs most significantly between boys and girls. Little more than 25% of Belmont girls are even considering majoring in math in college. Again, I attribute this to the traditional teaching methods and male-dominated math department.
Overall, fewer than half of girls in all four schools were interested in majoring in math in college, and with the exception of Cortines (the Arts-focused school), boys at the other three schools responded more positively to this statement. While I was encouraged to see that, in middle school, students' self-esteem about math (feeling like they are good at math) did not differ across the gender line, even though boys and girls feel equally capable, my data shows that girls still feel like math is "not for them" in greater numbers than boys. Furthermore, this data suggests that the disparity between the genders is magnified at traditional high schools in low-income areas where the instruction tends to be teacher-directed. Of course, more research would need to be done to verify this suggestion, but this data point is perhaps the most compelling case that further investigation should occur.
Finally, I asked the students to respond to a more controversial statement, "Males are better at Math than females." I definitely expected more boys to agree with this statement than girls. In retrospect, I regret not having posed the reverse statement, "Females are better at Math than males," to see how allegiance to one's own gender influences ones responses to both items.
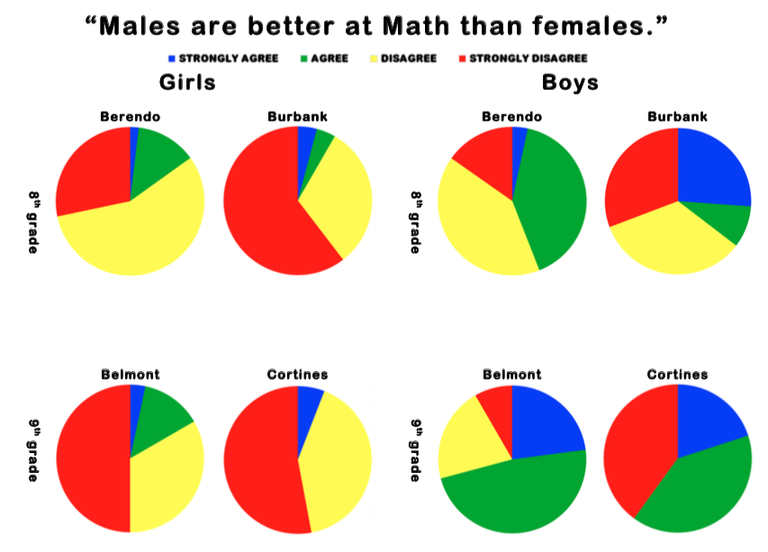 Despite my imperfect questioning techniques for this item, some data points still stand out to me. First, the majority of students in all sub-groups surveyed disagreed or strongly disagreed with the statement - with the exception of ninth-grade boys. The majority of boys from both high schools agreed with the statement. Thus, this data indicates that, as they grow older, males increasingly feel that they are superior to females in the area of math. Girls tend to disagree with this, but their views remain steady from middle school to high school.
Another interesting point in this data is that Burbank and Cortines, the schools that do the most collaborative, inquiry-based instruction, disagreed with the statement that males are better at math in higher numbers than at Berendo and Belmont, whose math programs follow more traditional methods and do not focus on group collaboration. This suggests that collaborative, student-centered math lessons empower female learners more than teacher-directed lessons with individual work. Again, the traditional teaching methods and male-dominated math department may have affected the Belmont boys' responses to this item, which were significantly more in agreement with the statement than any other subgroup.
Follow-Up
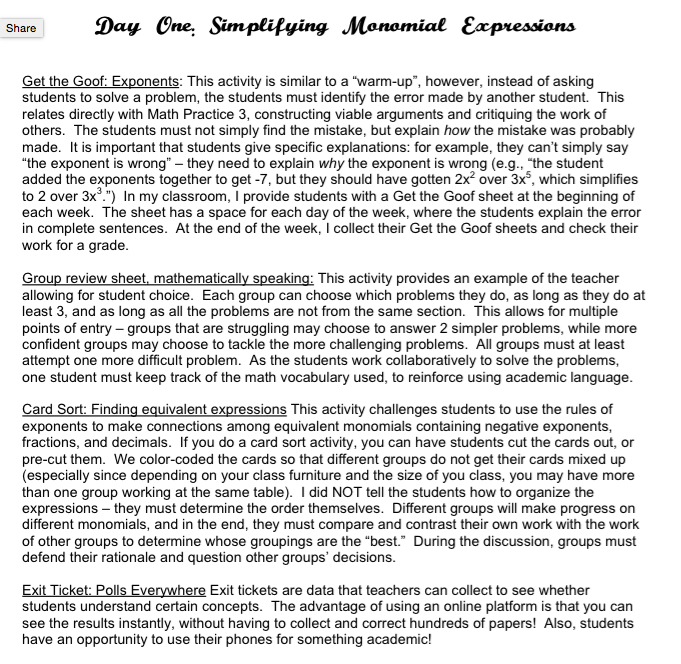
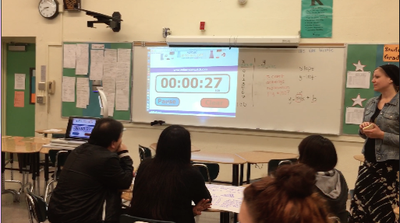 After seeing the results of this survey, the Belmont math department asked me for guidance about how to increase collaboration in their math classrooms. I worked with their Title III Coordinator (and former PLI alumna) Nury Arrivillaga to prepare a three-day demo lesson, where teachers, administrators, out-of-classroom staff, and students could drop in and participate in inquiry-based lessons. Each day, I provided teacher notes to re-cap the lesson and explain the rationale for the techniques I used. Below are the teacher notes for Day 1:
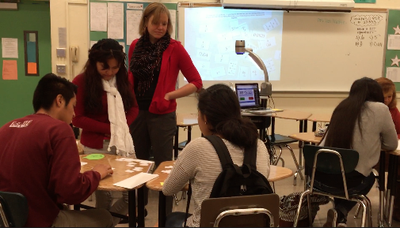 In attendance for the three sessions were the Belmont math teachers and several administrators, the principal and math teachers from nearby Los Angeles Teacher Prep High School (another school that I support through ISIC), and my supervisor at the time, Mara Simmons. Each session had about 15-20 student participants as well. I collected feedback about these sessions from adults and students who participated, via anonymous survey papers distributed at the end of each session. The student feedback was overwhelmingly positive. One student commented, "I liked working in a group. The questions were interesting and made me think a lot." This was a fairly typical student response. To see an example of the actual student survey, click here. The teacher responses were more varied - some were excited to use some of the techniques I demonstrated, while others commented that they did not find the sessions helpful.
In a follow-up meeting at Belmont, we discussed the demo-lessons. While the teachers had varying levels of interest in trying out some of the strategies I modeled in the lessons, they agreed that they would try my "get the goof" activity, which is similar to a warm-up problem but focuses on error analysis. For the remainder of the year, I continued to attend the Belmont teachers' monthly math PDs and offer support. While I was not successful in completely transforming the teaching styles of the entire math department, several teachers have begun to use more collaborative strategies in their classrooms.
For copies of the materials I distributed during the sample lessons, please click the links below.
Agenda for teachers and administrators
Patterns to Discuss in Groups for Day 2
Considerations for Next Time
In addition to modifying the last survey item (to include the statement "Females are better at Math than males"), there were several things I would have done differently, were I to do this project again. First, I would like to have collected data from more schools. Although I asked more middle and high schools to participate in the survey, the four schools I included were the only ones who both agreed to participate and provided enough data to be usable. I would have liked to include Young Oak Kim Academy, a middle school in Koreatown that has gender-segregated math classes, to see how their data compares to other middle schools' data, and to see how girls' responses differ from boys'. Unfortunately, I was unable to make a connection who was willing to administer the survey at that site. I also would have liked to have surveyed a greater age range of students. It would have been interesting to see how attitudes change from elementary school through twelfth grade. Because I work mostly with Algebra 1 classes in my current position, I decided to focus on eighth and ninth graders, but I realize that this is a very narrow age range.
Also, while I believe that this project sheds light on an important issue, it did not adequately answer the question about why girls disassociate themselves from math as they grow older and, as working adults, tend not to pursue STEM-related careers. My surveys could have benefitted from one-on-one interviews with students, and more in-depth conversations with teachers and administrators to discuss the root causes of this inequality.
Finally, if I were able to do this project again, I would focus more on the post-survey support and less on the actual survey. Because I changed my Leadership Project mid-way though the year, and because it took longer to collect the survey data than I had anticipated, I was not able to follow up with all of the schools. Although I did have the opportunity to support Belmont based on the survey results, my project would have been stronger if I had developed a way to monitor the change in teaching styles of individual teachers throughout the year, and to do a post-survey with students to see if the gender divide lessened as a result of increased teacher awareness and an effort to employ more collaborative teaching techniques in the math classrooms.
My Leadership Role
This project helped to shape my identity as a school leader, because I was able to communicate with teachers, administrators, and support staff at the four schools about an issue that I am passionate about: gender equity. I am confident that all of the teachers who administered the survey will be more mindful of gender equity in their math classes. Also, since none of the teachers expected the girls' data to show more negative math attitudes than the boys' data, I know that the survey results will challenge them to re-evaluate how their classroom climate and school-wide culture may influence gender bias in math classes. I also learned the importance of long-term, continuous professional development. My post-survey demo-lessons and professional development at Belmont were good starting-points, but in order to facilitate large-scale, long-term change, I will have to continue to meet with the math department, observe individual teachers, provide feedback, and suggest next steps.
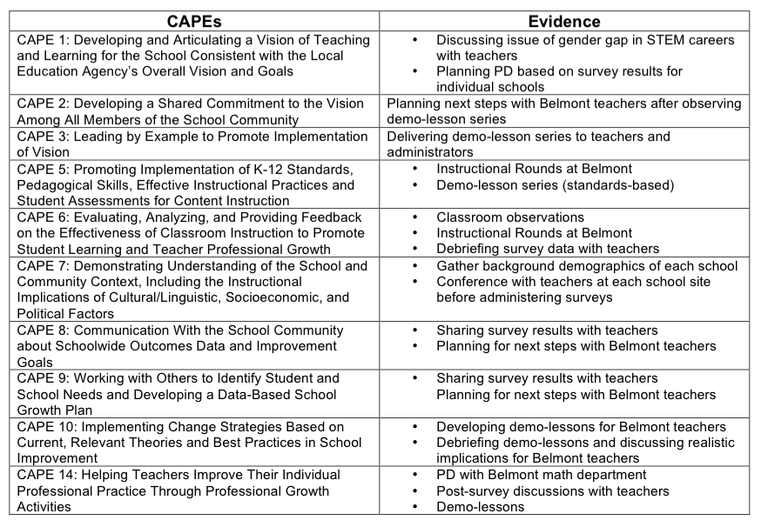
California Administrator Performance Expectations
Final Thoughts and Next Steps
I believe that the surveys definitely showed that boys are more likely to see themselves pursuing math in college and beyond, and the data seemed to suggest that collaboration and inquiry empower girls in their math classes more than teacher-driven direct instruction does. I also think that some of the Belmont teachers will use and improve upon the teaching strategies I showed them during my demo-lessons. As a next step, I would like to use the survey data to encourage schools to think more about making math more interactive. I would like this data to inspire more teachers to learn about constructivist teaching methods and to try to incorporate them into their teaching. I would also like to do more of a thorough follow-up with Belmont and the other schools, and to develop a long-term Professional Learning Community within the math department to address the gender gap in math and to brainstorm strategies to narrow the gap and improve teaching school-wide.

